Have Insecticides Become More Intense?
Sara Soba
2018-07-27
Last updated: 2018-08-09
workflowr checks: (Click a bullet for more information)-
✖ R Markdown file: uncommitted changes
The R Markdown file has unstaged changes. To know which version of the R Markdown file created these results, you’ll want to first commit it to the Git repo. If you’re still working on the analysis, you can ignore this warning. When you’re finished, you can runwflow_publishto commit the R Markdown file and build the HTML. -
✔ Environment: empty
Great job! The global environment was empty. Objects defined in the global environment can affect the analysis in your R Markdown file in unknown ways. For reproduciblity it’s best to always run the code in an empty environment.
-
✔ Seed:
set.seed(20180713)The command
set.seed(20180713)was run prior to running the code in the R Markdown file. Setting a seed ensures that any results that rely on randomness, e.g. subsampling or permutations, are reproducible. -
✔ Session information: recorded
Great job! Recording the operating system, R version, and package versions is critical for reproducibility.
-
Great! You are using Git for version control. Tracking code development and connecting the code version to the results is critical for reproducibility. The version displayed above was the version of the Git repository at the time these results were generated.✔ Repository version: 9972b21
Note that you need to be careful to ensure that all relevant files for the analysis have been committed to Git prior to generating the results (you can usewflow_publishorwflow_git_commit). workflowr only checks the R Markdown file, but you know if there are other scripts or data files that it depends on. Below is the status of the Git repository when the results were generated:
Note that any generated files, e.g. HTML, png, CSS, etc., are not included in this status report because it is ok for generated content to have uncommitted changes.Ignored files: Ignored: .Rhistory Ignored: .Rproj.user/ Ignored: Extra feature drafts/ Ignored: data/big_data/ Unstaged changes: Modified: Shiny2.0/ShinyApp1.R Modified: Shiny2.0/rsconnect/documents/ShinyApp1.R/shinyapps.io/pesticide-explorer/Shiny2.dcf Modified: analysis/California.Rmd Modified: analysis/Data.Rmd Modified: analysis/Tox_load_vig.Rmd Modified: analysis/neonic_vig.Rmd Staged changes: Modified: analysis/about.Rmd Modified: analysis/about_tox_load.Rmd
Expand here to see past versions:
| File | Version | Author | Date | Message |
|---|---|---|---|---|
| Rmd | e7d10a2 | ssoba | 2018-08-08 | Revised CA vignette and facetted a plot in intensity vignette |
| html | e7d10a2 | ssoba | 2018-08-08 | Revised CA vignette and facetted a plot in intensity vignette |
| html | f4ef47c | ssoba | 2018-08-07 | Forgot to wflow_build the last commit |
| Rmd | bb1bf40 | ssoba | 2018-08-06 | Got rid of code in GitHub site. Wrote Limitations to Data section and broadened introduction. Moved descriptions in shiny and extended sidebar |
| html | bb1bf40 | ssoba | 2018-08-06 | Got rid of code in GitHub site. Wrote Limitations to Data section and broadened introduction. Moved descriptions in shiny and extended sidebar |
| html | 36cbc40 | ssoba | 2018-08-06 | Build site. |
| html | 15a59b5 | ssoba | 2018-08-03 | Spelling fixes |
| html | 1d48d55 | ssoba | 2018-08-03 | Build site. |
| Rmd | dd313f8 | ssoba | 2018-08-01 | Fixed all spelling mistakes and some formatting issues |
| html | dd313f8 | ssoba | 2018-08-01 | Fixed all spelling mistakes and some formatting issues |
| Rmd | 568e676 | ssoba | 2018-08-01 | Finished Intensity vignette |
| html | 568e676 | ssoba | 2018-08-01 | Finished Intensity vignette |
| Rmd | d4000d2 | ssoba | 2018-08-01 | Added intro to intensity vignette |
| Rmd | 5e8616f | ssoba | 2018-08-01 | Re-did Intensity vignette and cleaned up Shiny doc |
| html | 5e8616f | ssoba | 2018-08-01 | Re-did Intensity vignette and cleaned up Shiny doc |
| html | 8b09700 | ssoba | 2018-08-01 | Build site. |
| Rmd | 4b1a915 | ssoba | 2018-07-31 | Added Vignette tab to nav bar, fixed California vignette to be insecticides not all pesticides. Cleaned up the Home page |
| html | 4b1a915 | ssoba | 2018-07-31 | Added Vignette tab to nav bar, fixed California vignette to be insecticides not all pesticides. Cleaned up the Home page |
| html | 9f2d09a | ssoba | 2018-07-31 | Added Graphs tab to nav bar |
| Rmd | 21935b8 | ssoba | 2018-07-30 | Facetted shiny app and updated gitignore |
| Rmd | ca7e234 | ssoba | 2018-07-27 | Adding new tab to Shiny app and started toxic load per kg applied vignette |
| html | ca7e234 | ssoba | 2018-07-27 | Adding new tab to Shiny app and started toxic load per kg applied vignette |
Introduction
One of the challenges in determining changes in insecticide use is figuring out how to measure and define those changes. A trend that many researchers have noticed is a decrease in amount of insecticides applied to crops. However, this measurement of insecticide use change only captures one aspect of the story.
In this vignette, we will try to understand insecticide use change not through absolute amount applied, but through intensity measured in toxic load per acre of land.
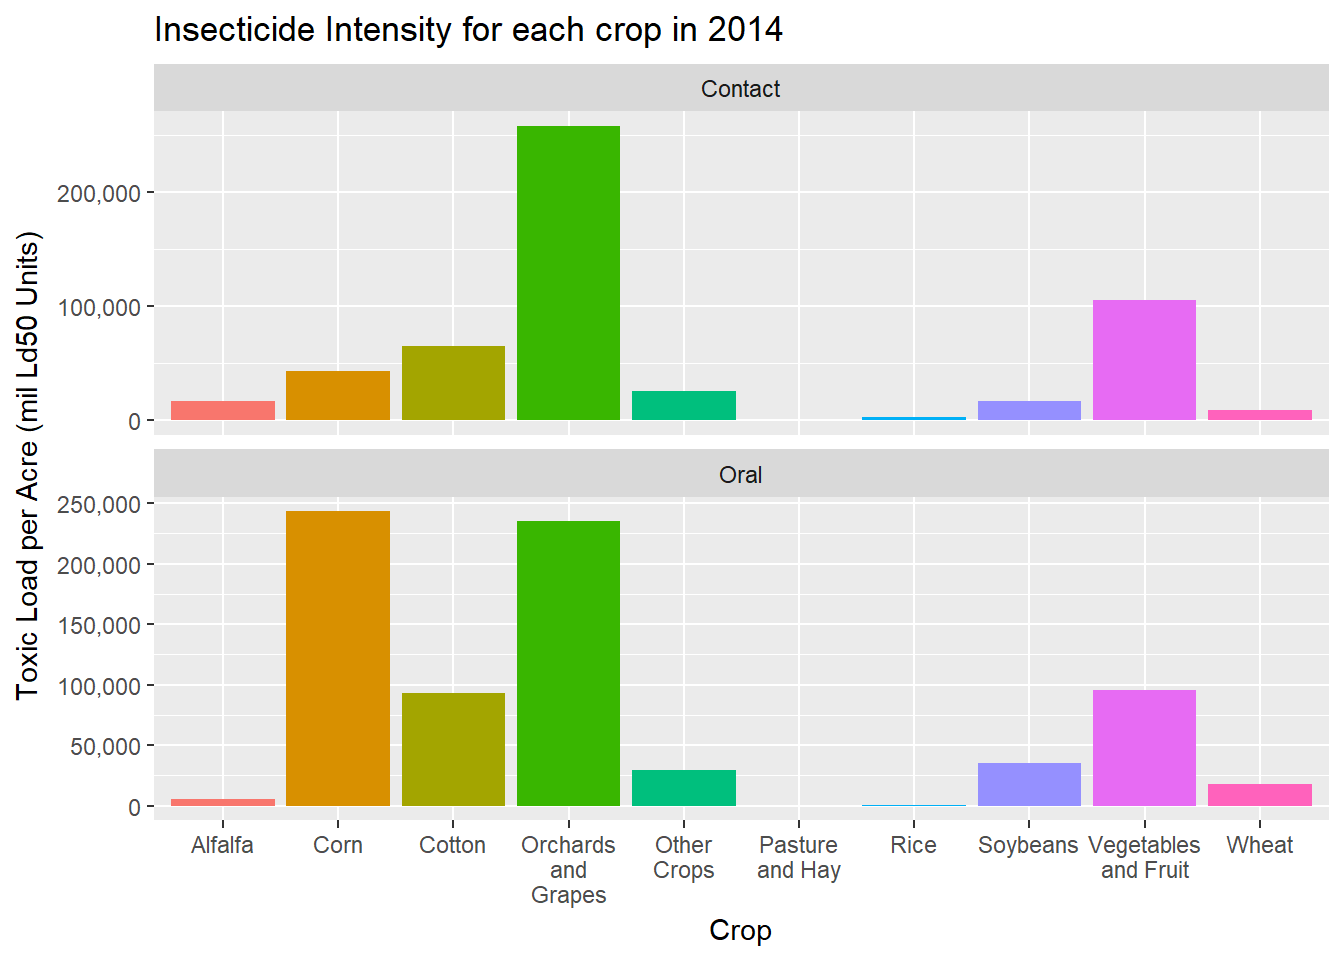
Most Recent Levels (2014)
Expand here to see past versions of unnamed-chunk-4-1.png:
| Version | Author | Date |
|---|---|---|
| e7d10a2 | ssoba | 2018-08-08 |
| 36cbc40 | ssoba | 2018-08-06 |
| dd313f8 | ssoba | 2018-08-01 |
| 568e676 | ssoba | 2018-08-01 |
| 5e8616f | ssoba | 2018-08-01 |
Note the different y-axis scales.
Here we see that orchards and grape insecticides are some of the most intense within the contact toxicity, while both corn and orchards and grapes are the most intense within oral toxicity.
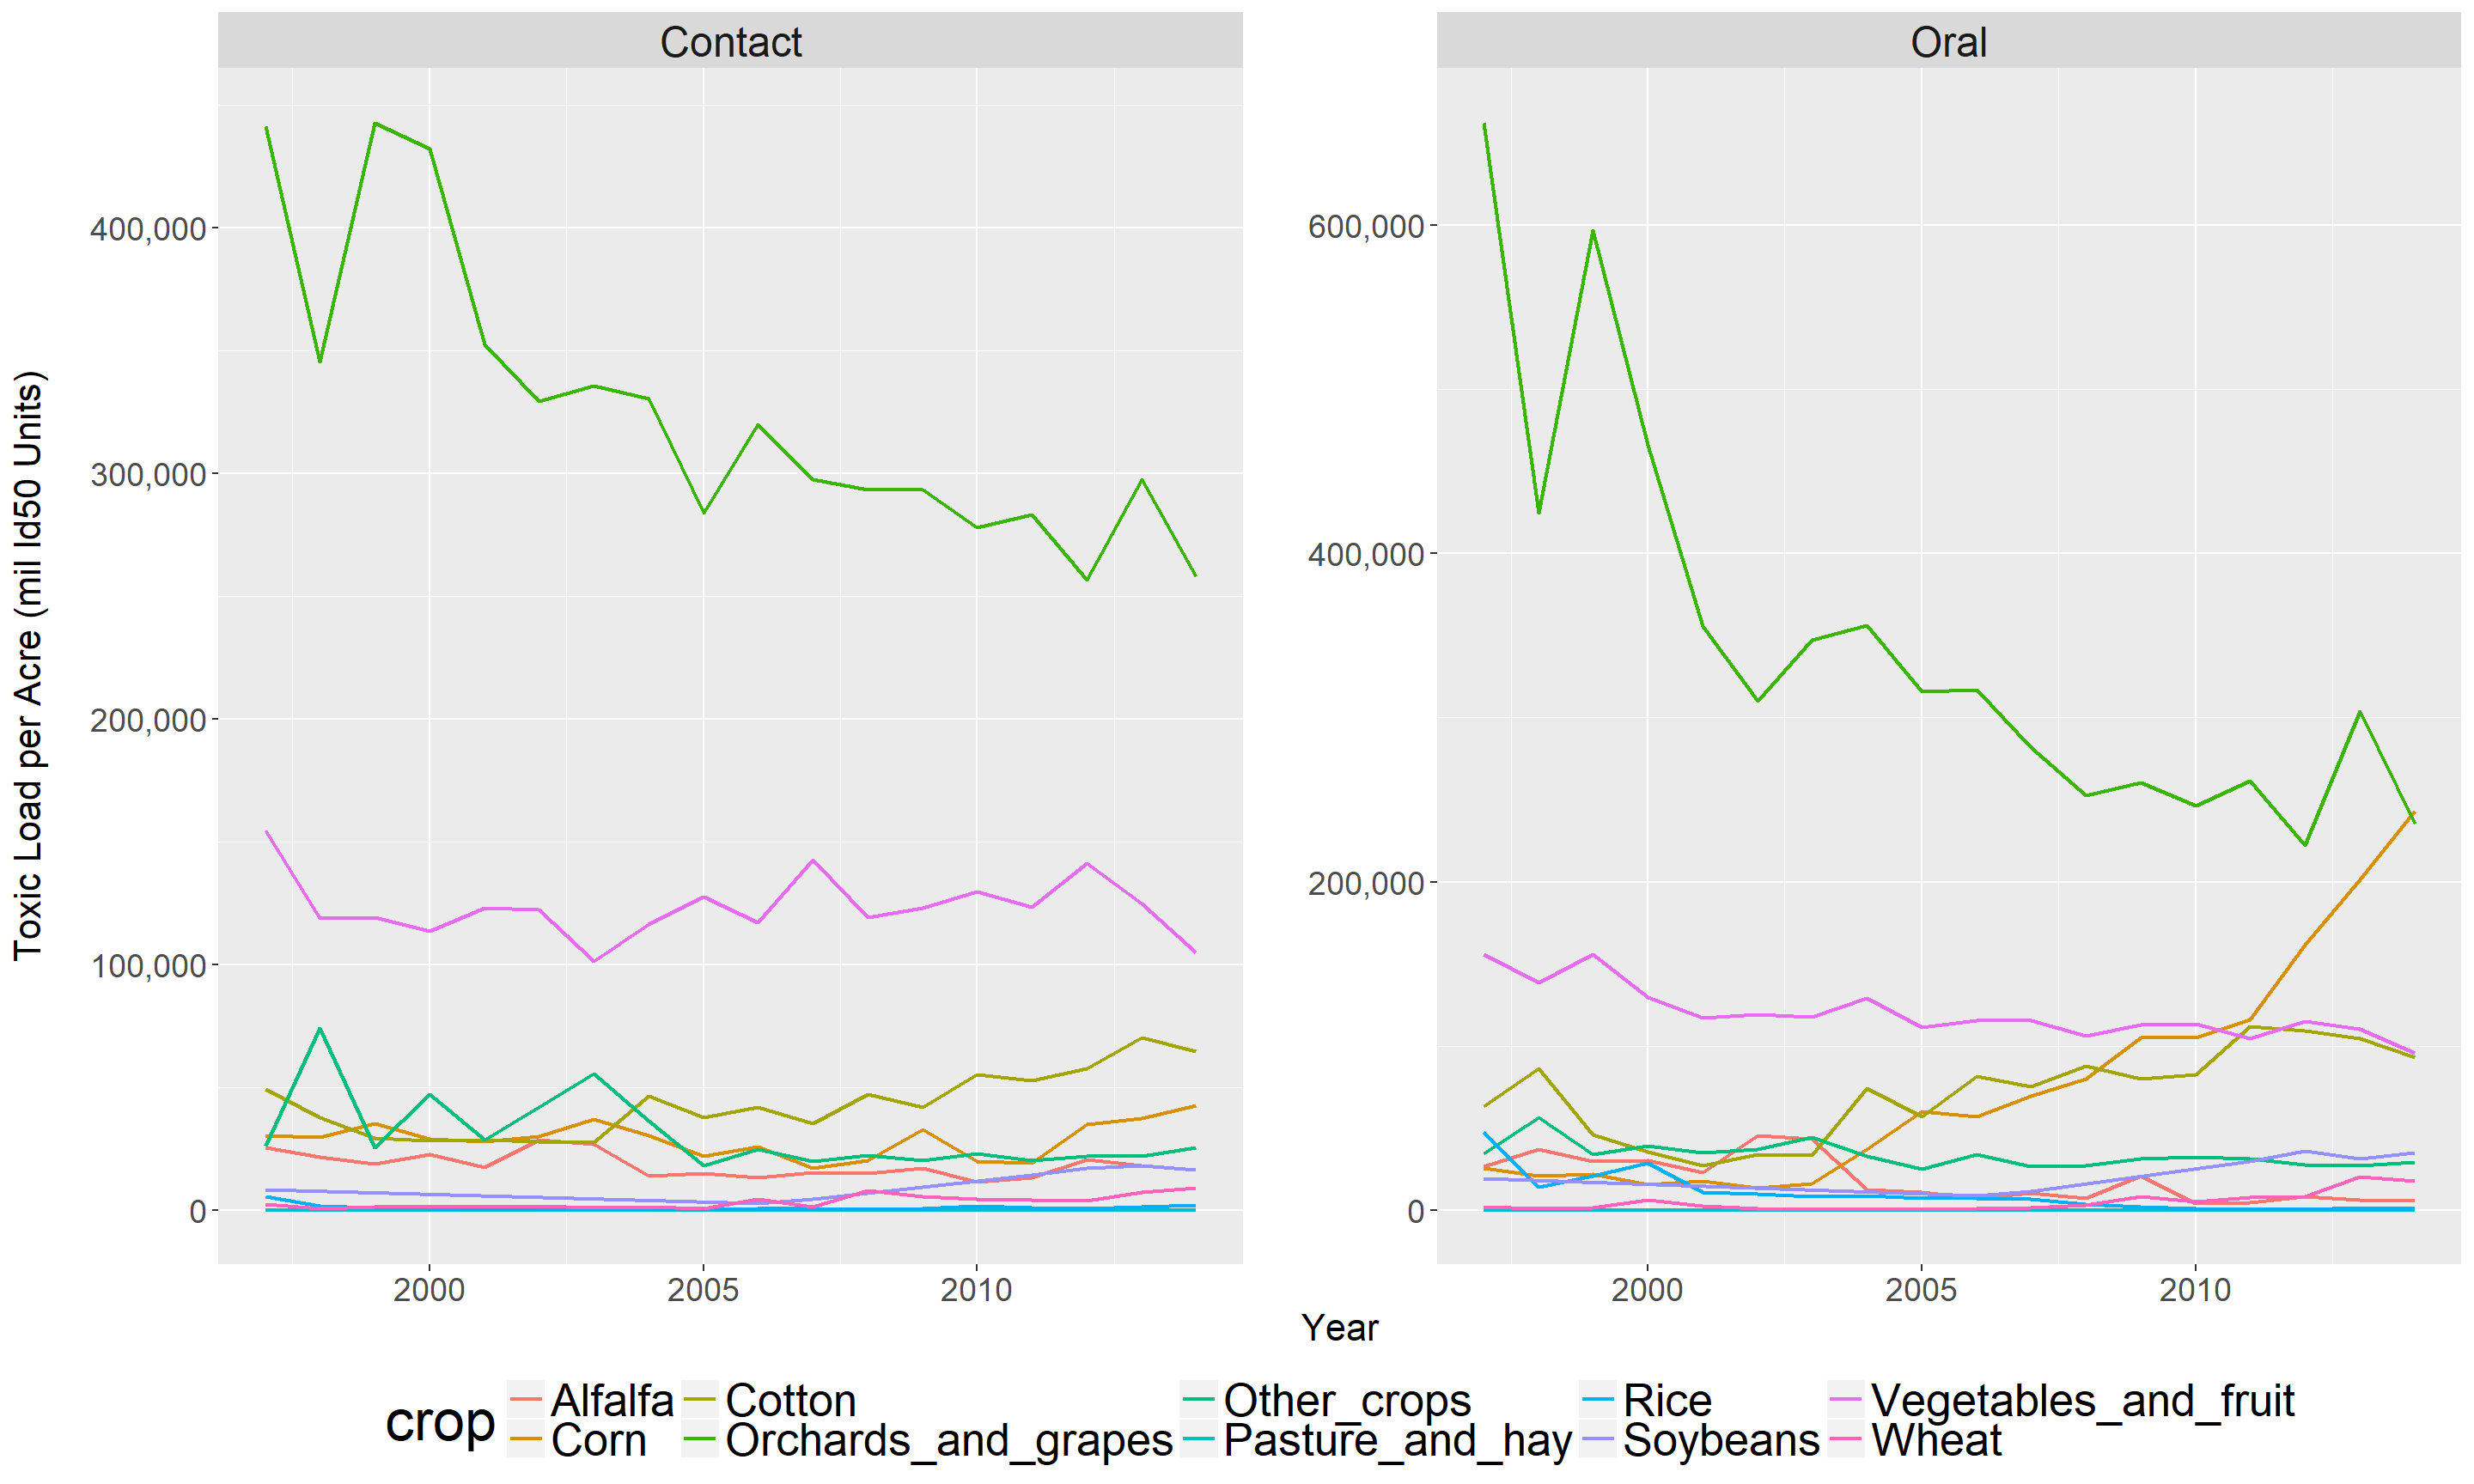
Let’s take a look at intense insecticides were previous to 2014.
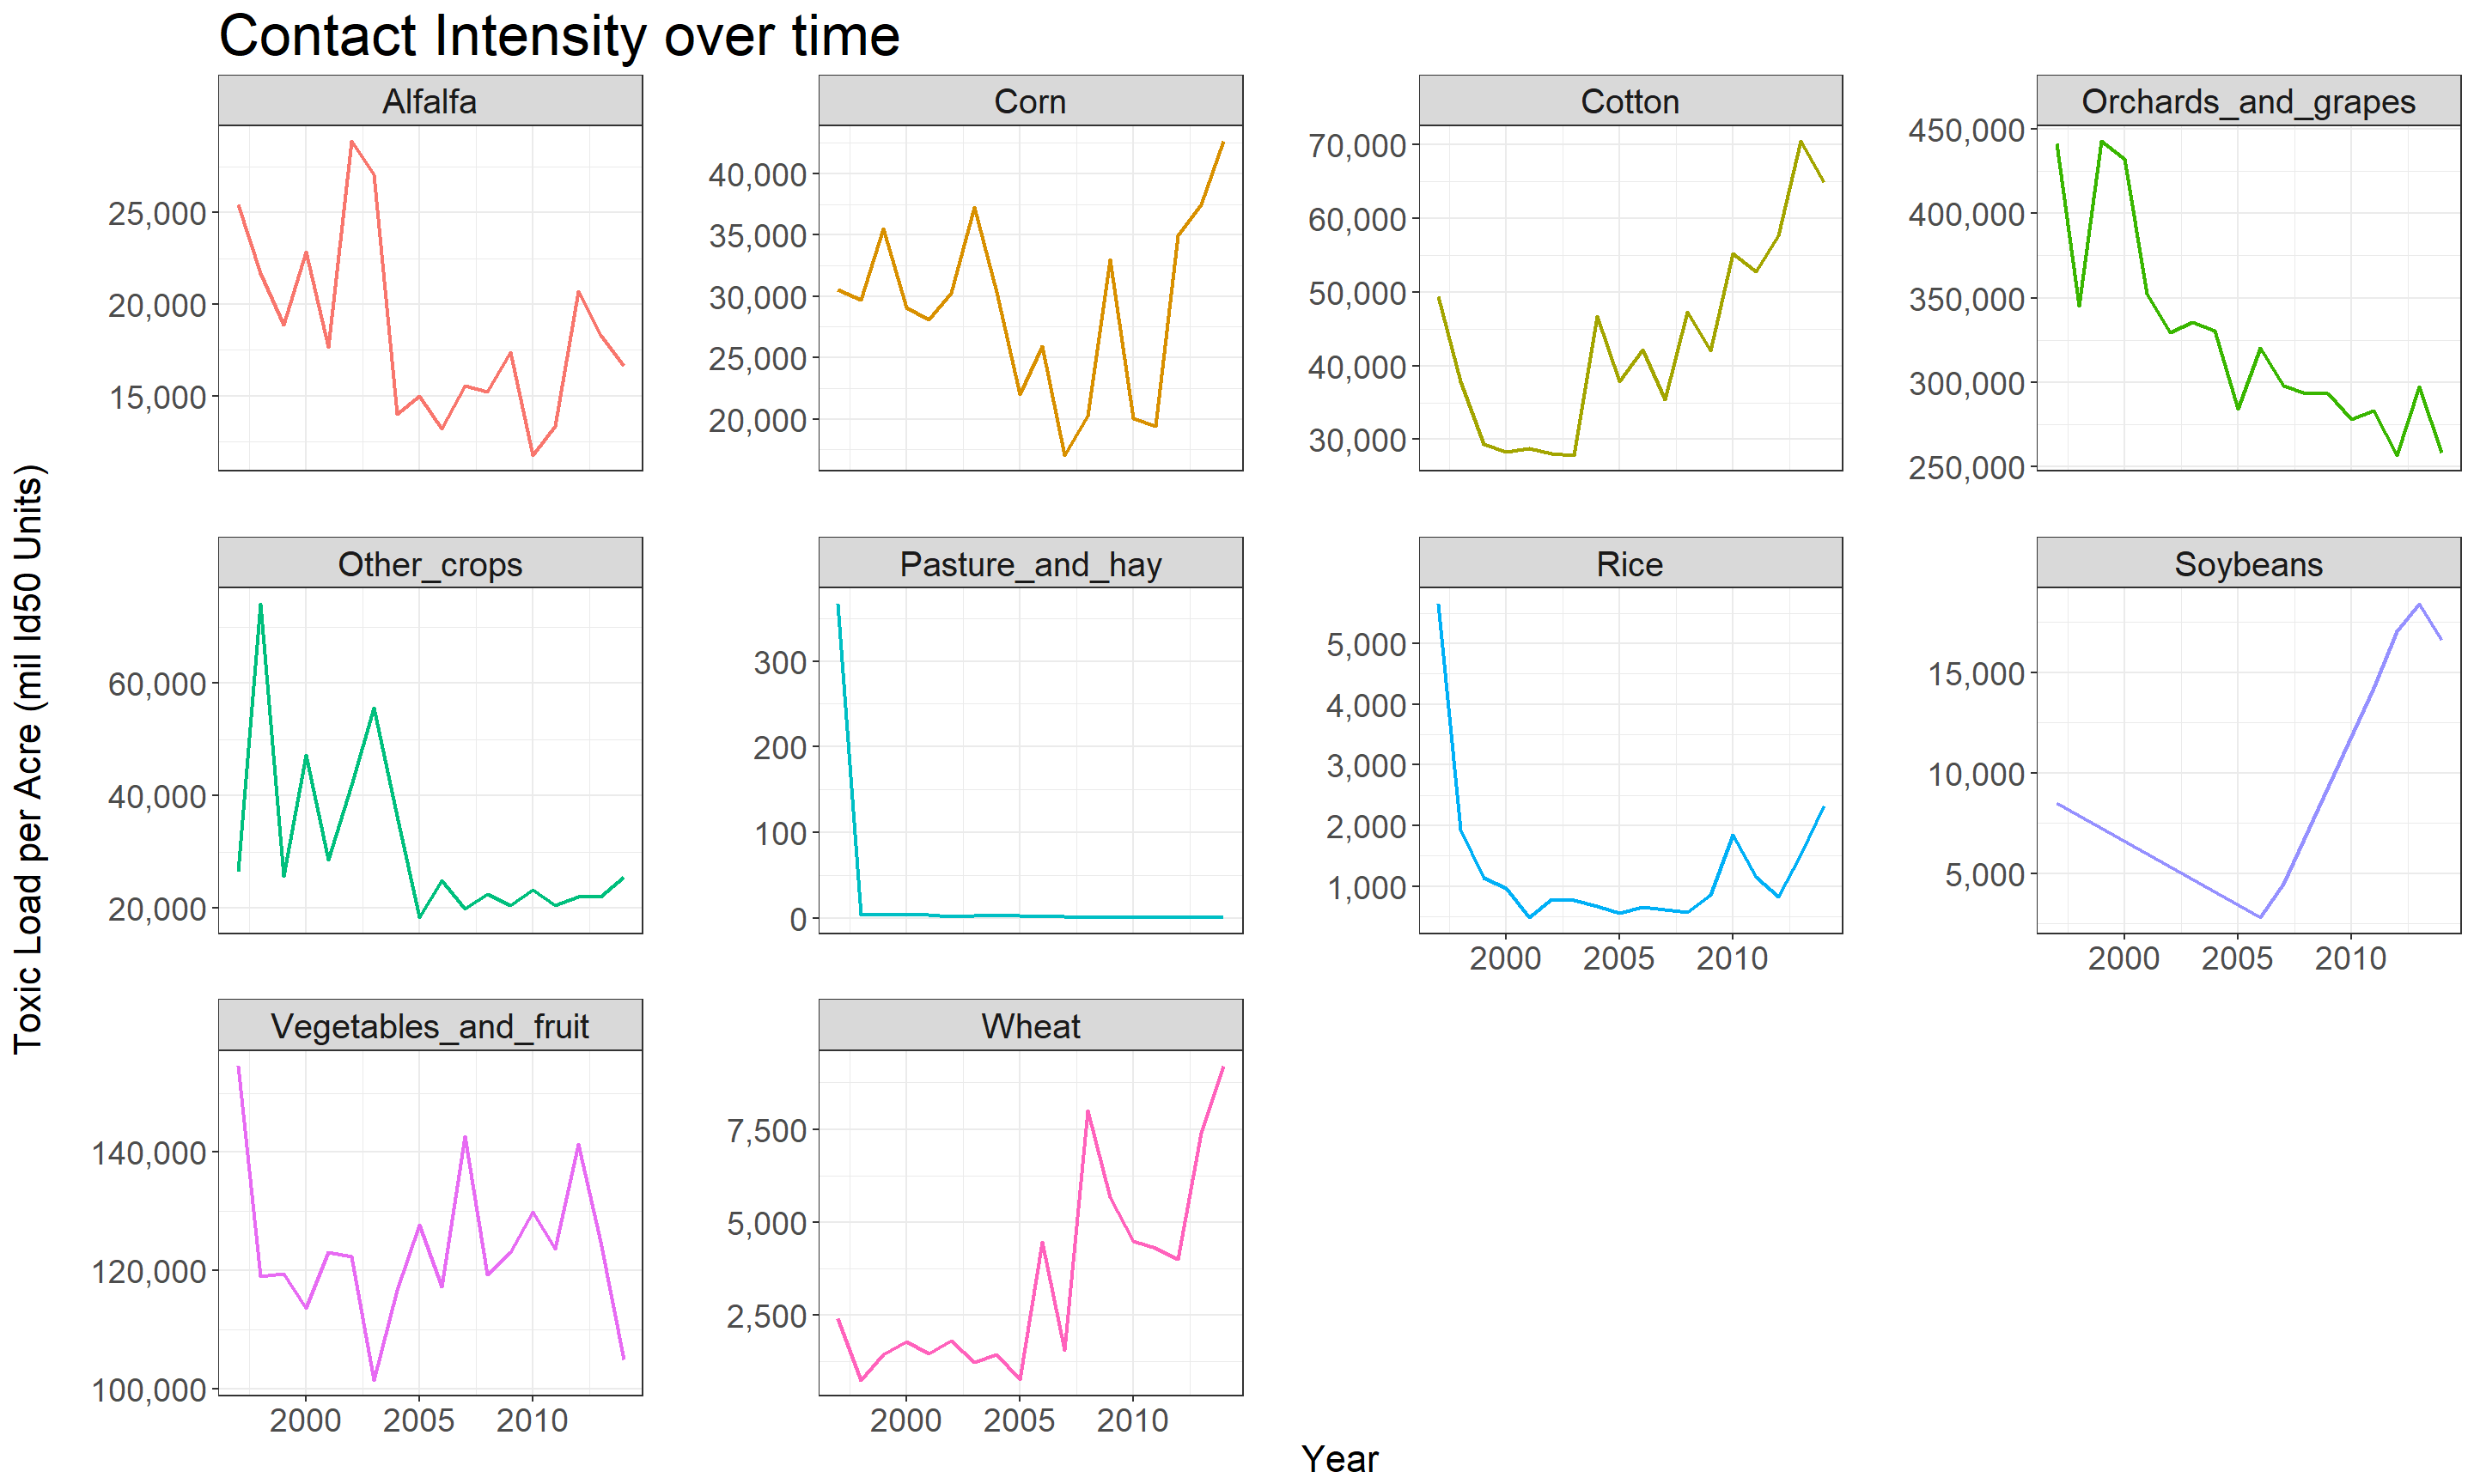
Change over last 18 years
Expand here to see past versions of unnamed-chunk-6-1.png:
| Version | Author | Date |
|---|---|---|
| e7d10a2 | ssoba | 2018-08-08 |
| 36cbc40 | ssoba | 2018-08-06 |
| dd313f8 | ssoba | 2018-08-01 |
| 568e676 | ssoba | 2018-08-01 |
| 5e8616f | ssoba | 2018-08-01 |
| 8b09700 | ssoba | 2018-08-01 |
| 4b1a915 | ssoba | 2018-07-31 |
| ca7e234 | ssoba | 2018-07-27 |
Below we can view the same graph as above, just as line graphs to see differences in crops a bit better.
Expand here to see past versions of unnamed-chunk-8-1.png:
| Version | Author | Date |
|---|---|---|
| e7d10a2 | ssoba | 2018-08-08 |
| 8b09700 | ssoba | 2018-08-01 |
| 4b1a915 | ssoba | 2018-07-31 |
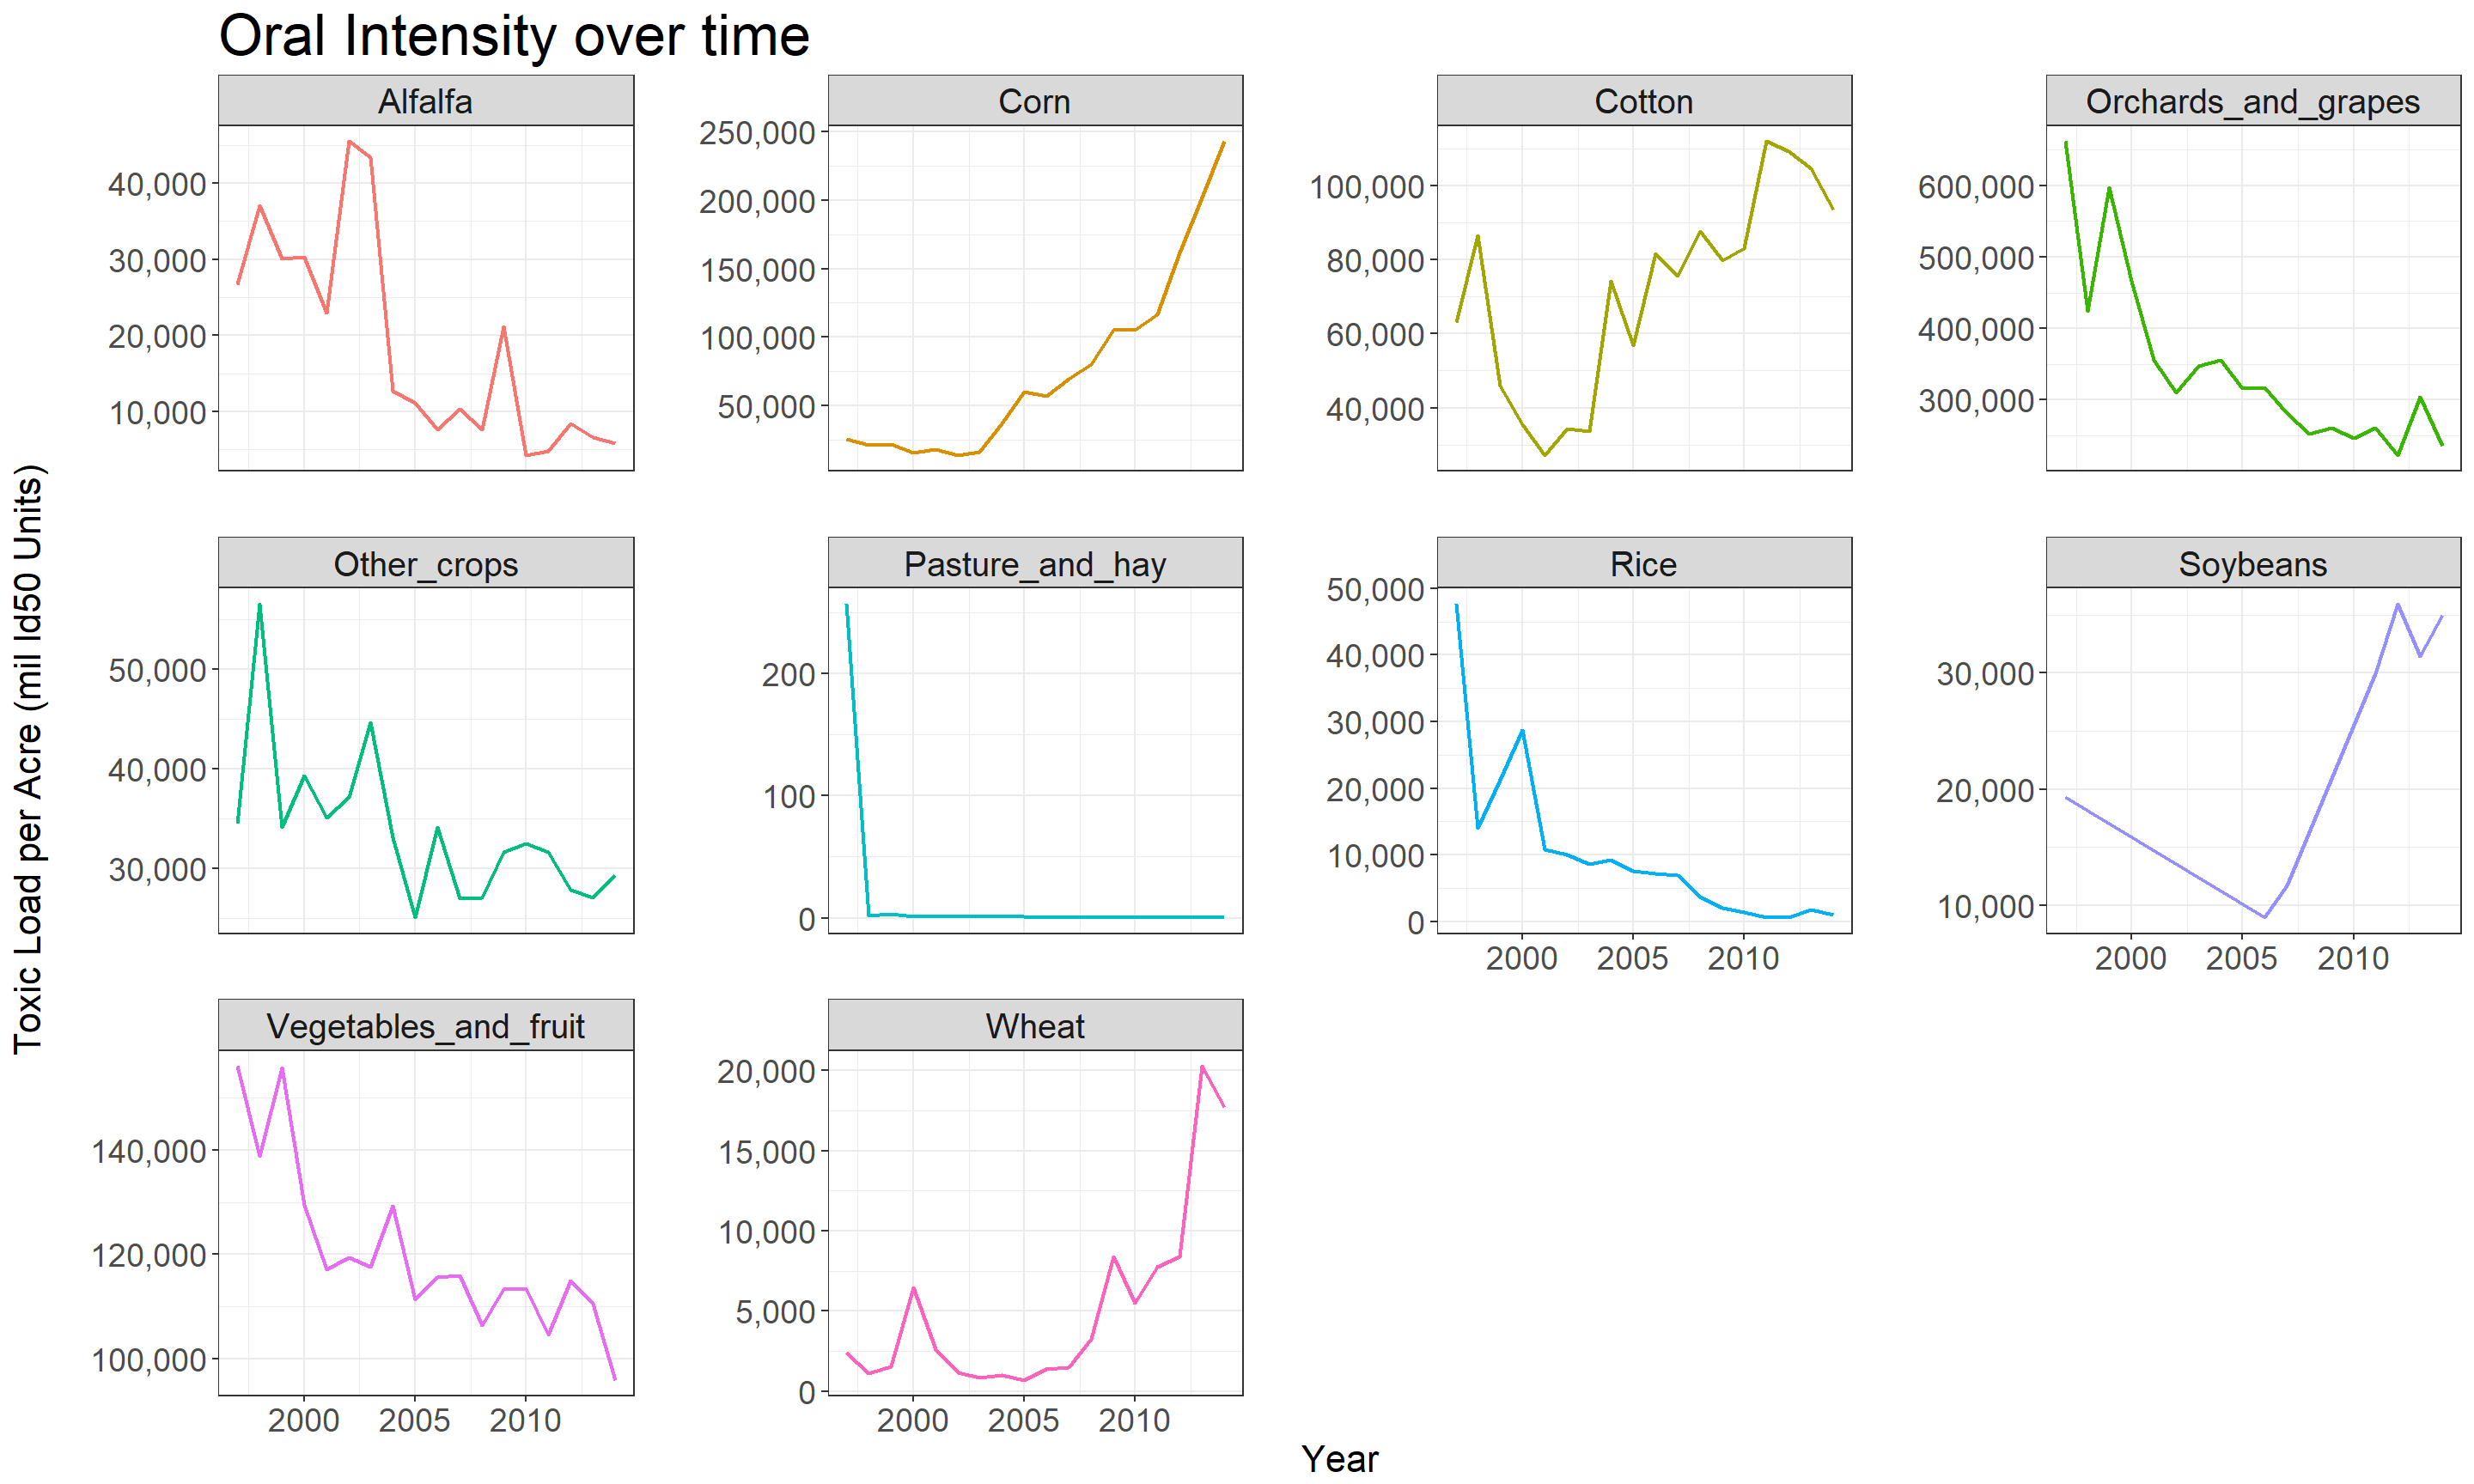
Conclusions
The crops with decreasing insecticide intensity appear to be Other Crops, Orchards and Grapes, Pasture and Hay, and Rice, with Orchards and grapes accounting for the most significant decrease. The insecticides used in the rest of the crops have either increased in intensity or have oscillated with no significant change (at least visible from the above graphs).
These are interesting trends to see because at the start of this vignette, we saw that insecticides used on Orchards and Grapes were the most intense (in terms of contact toxic load per acre) out of all the crops; yet, we also see that these insecticides have also decreased dramatically in intensity since the late 1990s. One possible explanation would be that the Food Quality Protection Act was passed in 1996 and encouraged a decrease in the use of organophosphate insecticides.
Continue investigating insecticide use by reading about changes in the world’s most widely used class of insecticides: neonicotinoids
Session information
sessionInfo()R version 3.5.0 (2018-04-23)
Platform: x86_64-w64-mingw32/x64 (64-bit)
Running under: Windows 10 x64 (build 16299)
Matrix products: default
locale:
[1] LC_COLLATE=English_United States.1252
[2] LC_CTYPE=English_United States.1252
[3] LC_MONETARY=English_United States.1252
[4] LC_NUMERIC=C
[5] LC_TIME=English_United States.1252
attached base packages:
[1] stats graphics grDevices utils datasets methods base
other attached packages:
[1] bindrcpp_0.2.2 scales_0.5.0 forcats_0.3.0 stringr_1.3.1
[5] purrr_0.2.5 readr_1.1.1 tidyr_0.8.1 tibble_1.4.2
[9] ggplot2_2.2.1 tidyverse_1.2.1 dplyr_0.7.5
loaded via a namespace (and not attached):
[1] tidyselect_0.2.4 reshape2_1.4.3 haven_1.1.2
[4] lattice_0.20-35 colorspace_1.3-2 htmltools_0.3.6
[7] yaml_2.1.19 rlang_0.2.1 R.oo_1.22.0
[10] pillar_1.2.3 foreign_0.8-70 glue_1.2.0
[13] R.utils_2.6.0 modelr_0.1.2 readxl_1.1.0
[16] bindr_0.1.1 plyr_1.8.4 munsell_0.5.0
[19] gtable_0.2.0 workflowr_1.1.1 cellranger_1.1.0
[22] rvest_0.3.2 R.methodsS3_1.7.1 psych_1.8.4
[25] evaluate_0.10.1 labeling_0.3 knitr_1.20
[28] parallel_3.5.0 broom_0.4.4 Rcpp_0.12.17
[31] backports_1.1.2 jsonlite_1.5 mnormt_1.5-5
[34] hms_0.4.2 digest_0.6.15 stringi_1.1.7
[37] grid_3.5.0 rprojroot_1.3-2 cli_1.0.0
[40] tools_3.5.0 magrittr_1.5 lazyeval_0.2.1
[43] crayon_1.3.4 whisker_0.3-2 pkgconfig_2.0.1
[46] xml2_1.2.0 lubridate_1.7.4 rstudioapi_0.7
[49] assertthat_0.2.0 rmarkdown_1.10 httr_1.3.1
[52] R6_2.2.2 nlme_3.1-137 git2r_0.22.1
[55] compiler_3.5.0 This reproducible R Markdown analysis was created with workflowr 1.1.1