Trends in Neonicotinoids
Sara Soba
2018-08-02
Last updated: 2018-10-08
workflowr checks: (Click a bullet for more information)-
✖ R Markdown file: uncommitted changes
The R Markdown file has unstaged changes. To know which version of the R Markdown file created these results, you’ll want to first commit it to the Git repo. If you’re still working on the analysis, you can ignore this warning. When you’re finished, you can runwflow_publishto commit the R Markdown file and build the HTML. -
✔ Environment: empty
Great job! The global environment was empty. Objects defined in the global environment can affect the analysis in your R Markdown file in unknown ways. For reproduciblity it’s best to always run the code in an empty environment.
-
✔ Seed:
set.seed(20180713)The command
set.seed(20180713)was run prior to running the code in the R Markdown file. Setting a seed ensures that any results that rely on randomness, e.g. subsampling or permutations, are reproducible. -
✔ Session information: recorded
Great job! Recording the operating system, R version, and package versions is critical for reproducibility.
-
Great! You are using Git for version control. Tracking code development and connecting the code version to the results is critical for reproducibility. The version displayed above was the version of the Git repository at the time these results were generated.✔ Repository version: 0d0b30d
Note that you need to be careful to ensure that all relevant files for the analysis have been committed to Git prior to generating the results (you can usewflow_publishorwflow_git_commit). workflowr only checks the R Markdown file, but you know if there are other scripts or data files that it depends on. Below is the status of the Git repository when the results were generated:
Note that any generated files, e.g. HTML, png, CSS, etc., are not included in this status report because it is ok for generated content to have uncommitted changes.Ignored files: Ignored: .DS_Store Ignored: .Rhistory Ignored: .Rproj.user/ Ignored: Extra feature drafts/ Ignored: Shiny App Practice.R Ignored: Shiny2.0/.DS_Store Ignored: data/.DS_Store Ignored: data/big_data/ Untracked files: Untracked: pesticide_explorer-Sara’s MacBook Pro.Rproj Unstaged changes: Modified: analysis/California.Rmd Modified: analysis/Data.Rmd Modified: analysis/Tox_load_vig.Rmd Modified: analysis/about_tox_load.Rmd Modified: analysis/neonic_vig.Rmd
Expand here to see past versions:
| File | Version | Author | Date | Message |
|---|---|---|---|---|
| Rmd | 6d69e9e | ssoba | 2018-08-09 | Revised GitHub website for all typos |
| html | 6d69e9e | ssoba | 2018-08-09 | Revised GitHub website for all typos |
| Rmd | fcdea4c | ssoba | 2018-08-09 | Added select all/deselect all buttons to shiny. Facetted a plot in neonicotinoid vignette. All features on website and Shiny are finishsed! |
| html | fcdea4c | ssoba | 2018-08-09 | Added select all/deselect all buttons to shiny. Facetted a plot in neonicotinoid vignette. All features on website and Shiny are finishsed! |
| html | f4ef47c | ssoba | 2018-08-07 | Forgot to wflow_build the last commit |
| Rmd | bb1bf40 | ssoba | 2018-08-06 | Got rid of code in GitHub site. Wrote Limitations to Data section and broadened introduction. Moved descriptions in shiny and extended sidebar |
| html | bb1bf40 | ssoba | 2018-08-06 | Got rid of code in GitHub site. Wrote Limitations to Data section and broadened introduction. Moved descriptions in shiny and extended sidebar |
| html | 36cbc40 | ssoba | 2018-08-06 | Build site. |
| Rmd | 15a59b5 | ssoba | 2018-08-03 | Spelling fixes |
| html | 15a59b5 | ssoba | 2018-08-03 | Spelling fixes |
| html | 1d48d55 | ssoba | 2018-08-03 | Build site. |
| Rmd | b350230 | ssoba | 2018-08-03 | Cleaned up neonicotinoid vignette |
| html | b350230 | ssoba | 2018-08-03 | Cleaned up neonicotinoid vignette |
| html | 67b36d3 | ssoba | 2018-08-03 | Merge branch ‘master’ of https://github.com/land-4-bees/pesticide_explorer |
| Rmd | 3b811aa | ssoba | 2018-08-03 | Continued neonicotinoid analysis |
| html | 3b811aa | ssoba | 2018-08-03 | Continued neonicotinoid analysis |
| Rmd | b6040d5 | ssoba | 2018-08-03 | Continued neonicotinoid analysis |
| html | 98ca6ff | ssoba | 2018-08-03 | Trying to make neonicotinoid vignette appear |
| Rmd | 312f6b7 | ssoba | 2018-08-03 | fixed yaml and corrected merge |
| html | 312f6b7 | ssoba | 2018-08-03 | fixed yaml and corrected merge |
| Rmd | 9b8390e | ssoba | 2018-08-03 | Merge branch ‘master’ of https://github.com/land-4-bees/pesticide_explorer |
| html | 9b8390e | ssoba | 2018-08-03 | Merge branch ‘master’ of https://github.com/land-4-bees/pesticide_explorer |
| Rmd | 3ee9a38 | ssoba | 2018-08-02 | Started neonicotinoid vignette! |
| html | 3ee9a38 | ssoba | 2018-08-02 | Started neonicotinoid vignette! |
| Rmd | cee2316 | ssoba | 2018-08-02 | Started neonicotinoid vignette! |
| html | cee2316 | ssoba | 2018-08-02 | Started neonicotinoid vignette! |
Introduction
In this vignette, we will explore trends in the most widely used class of insecticides worldwide: neonicotinoids1. Neonicotinoids are systematic insecticides that resemble nicotine. They are commonly used in crop seed treatments.
Has usage of neonicotinoids been increasing?
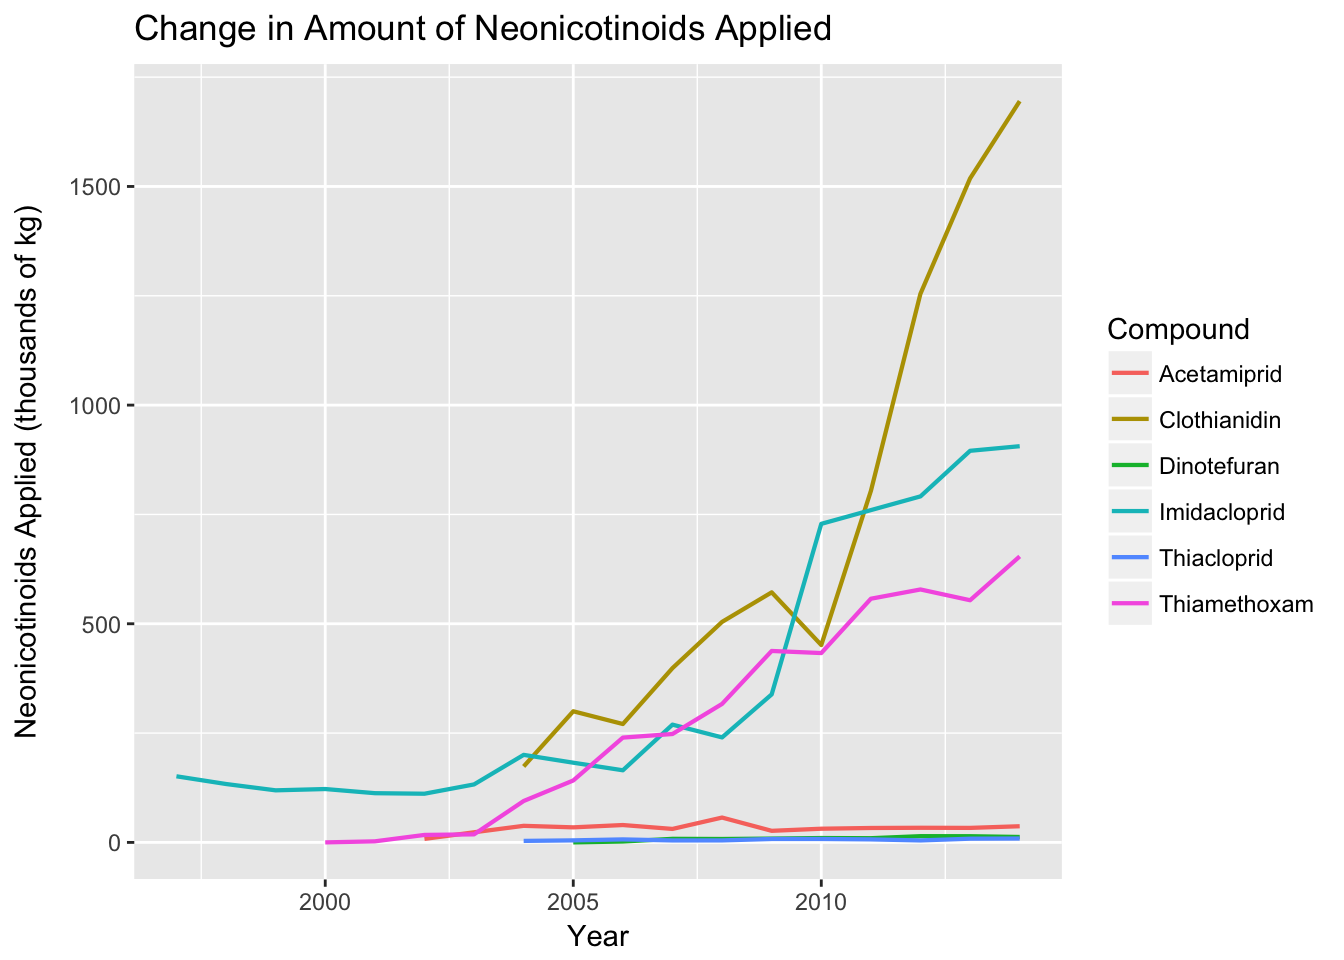
We will start with creating some basic visualizations to see if there are any intriguing trends. This first graph displays how many kilograms of neonicotinoids were applied in the U.S. during each year starting in 1997 and ending in 2014.
Expand here to see past versions of unnamed-chunk-5-1.png:
| Version | Author | Date |
|---|---|---|
| 36cbc40 | ssoba | 2018-08-06 |
| b350230 | ssoba | 2018-08-03 |
| 3ee9a38 | ssoba | 2018-08-02 |
Next we’ll look at the intensity of neonicotinoid applications. 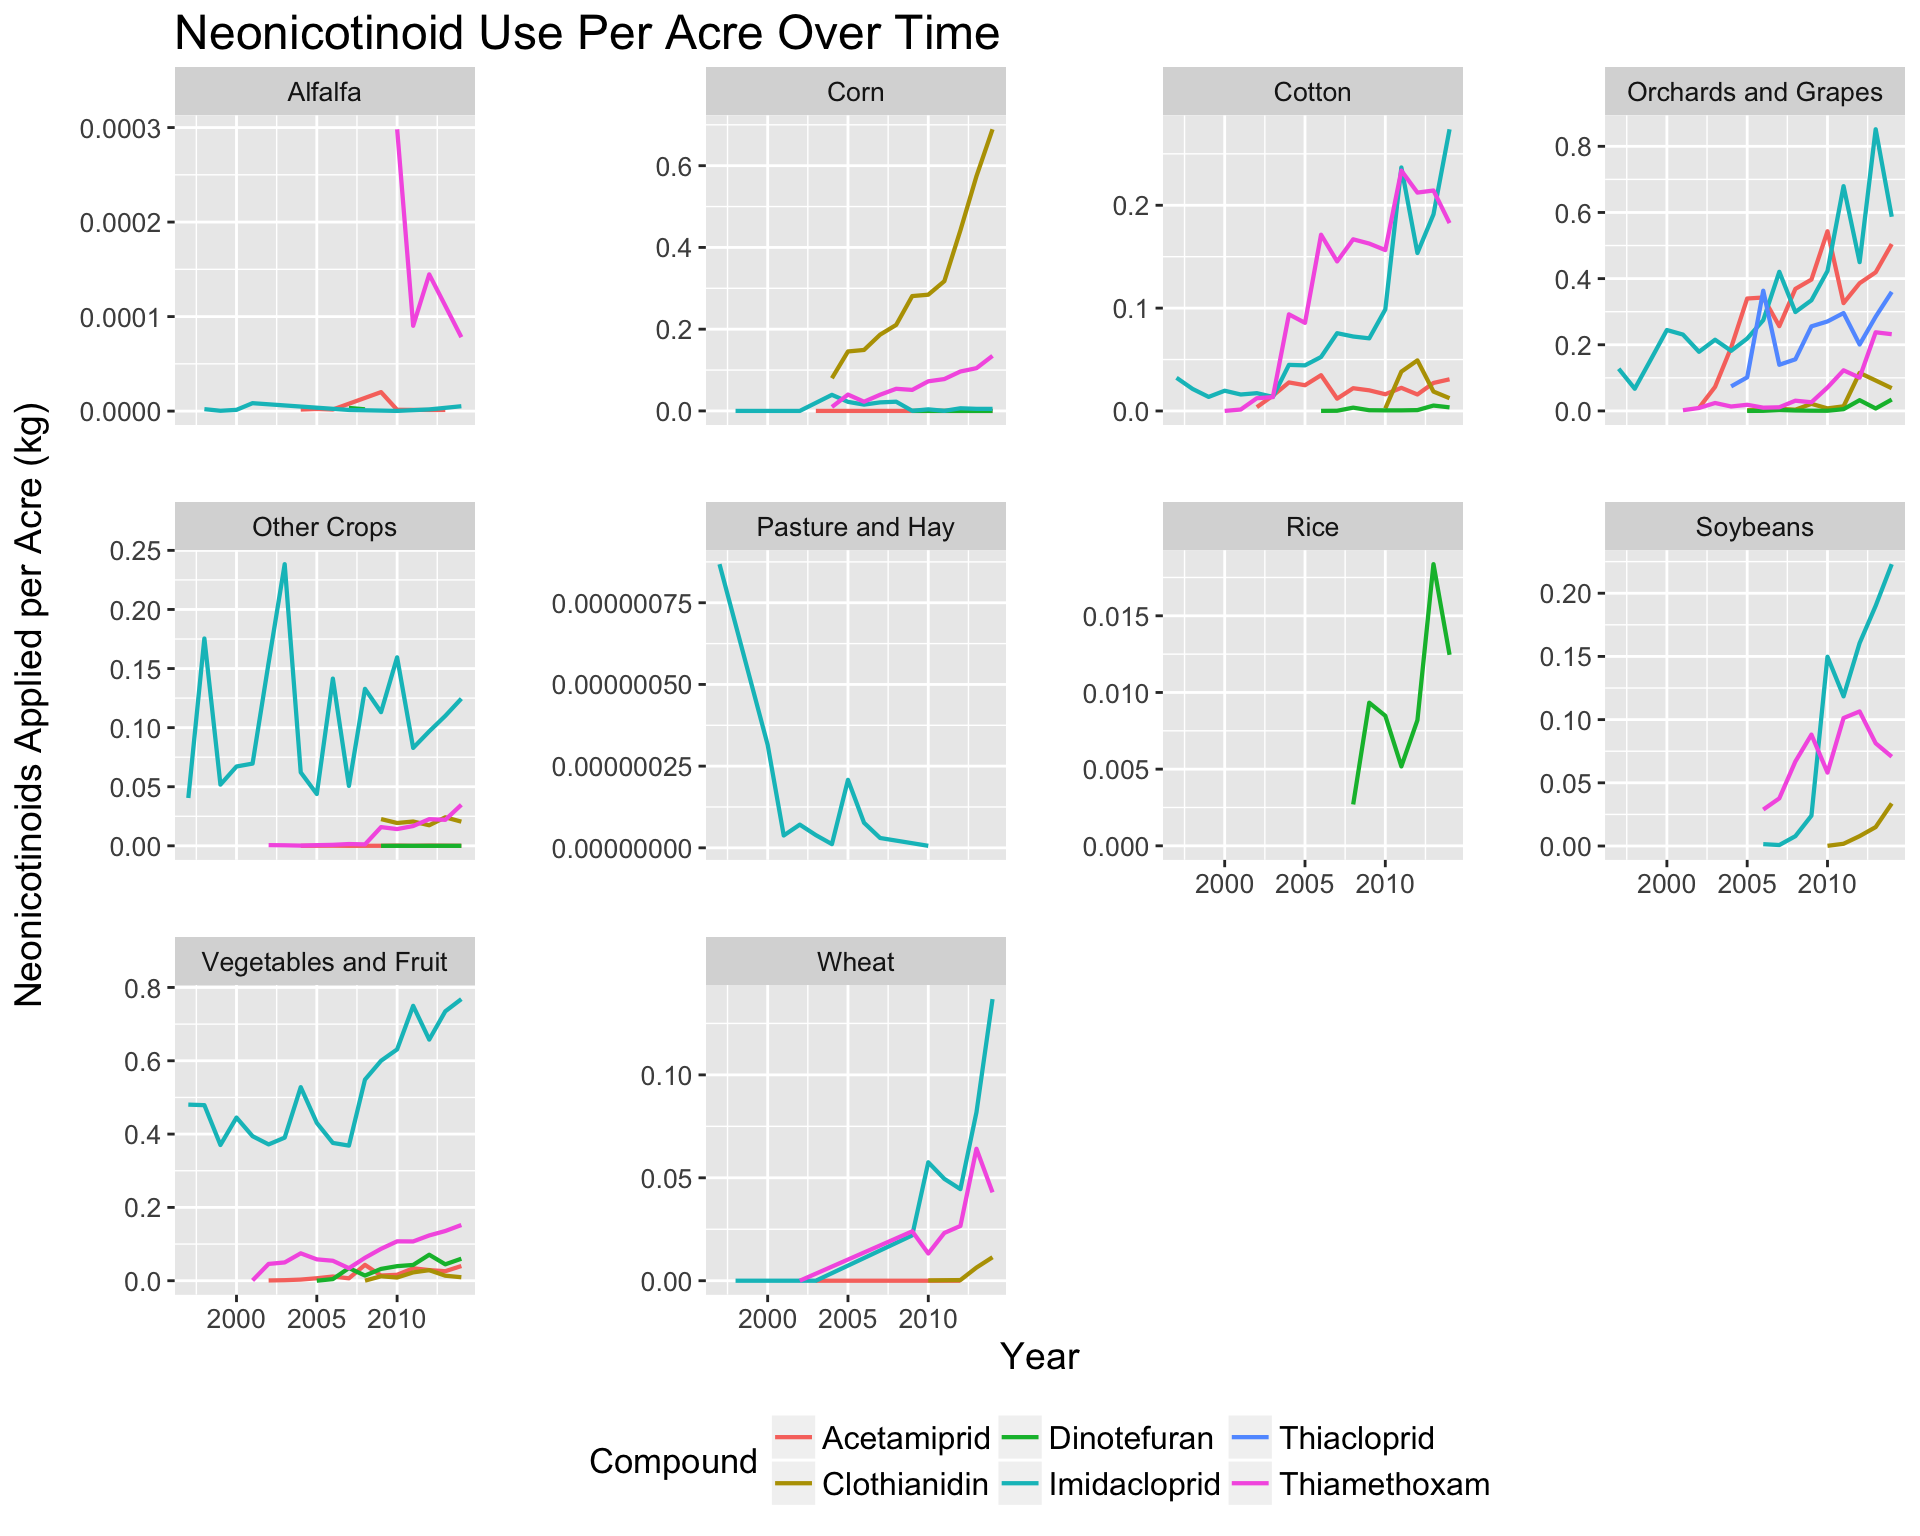
Expand here to see past versions of unnamed-chunk-6-1.png:
| Version | Author | Date |
|---|---|---|
| fcdea4c | ssoba | 2018-08-09 |
| 36cbc40 | ssoba | 2018-08-06 |
| b350230 | ssoba | 2018-08-03 |
| 3ee9a38 | ssoba | 2018-08-02 |
In both of the above plots we see that neonicotinoid use has increased dramatically in the last 18 years, both in total amount applied and in density (use per acre). Now let’s see how neonicotinoid use has increased with respect to all other types of insecticides used.
Use Relative to Other Insecticides
Expand here to see past versions of unnamed-chunk-8-1.png:
| Version | Author | Date |
|---|---|---|
| 36cbc40 | ssoba | 2018-08-06 |
| b350230 | ssoba | 2018-08-03 |
| 3ee9a38 | ssoba | 2018-08-02 |
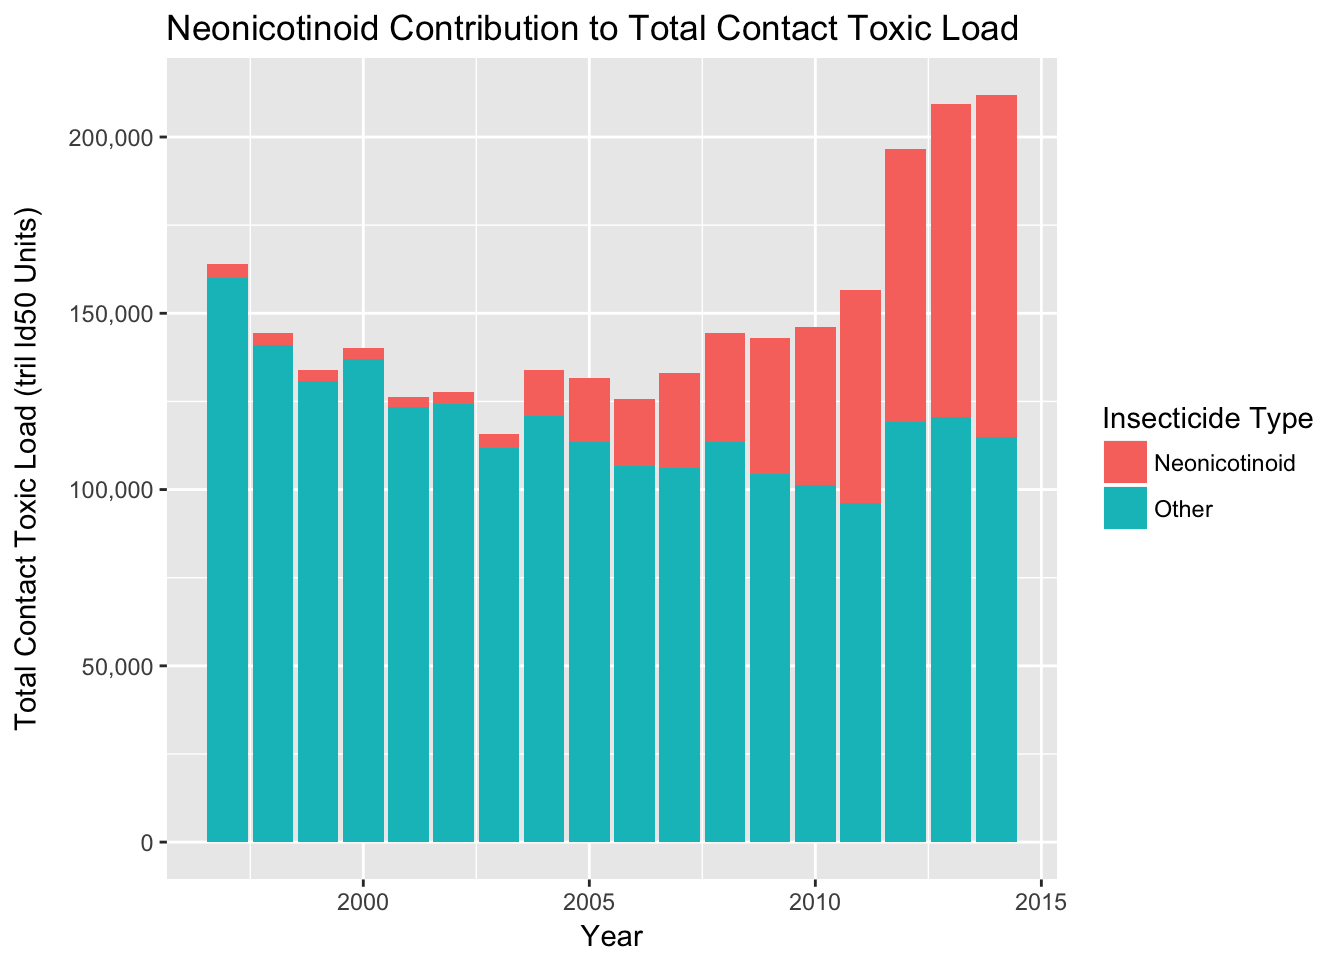
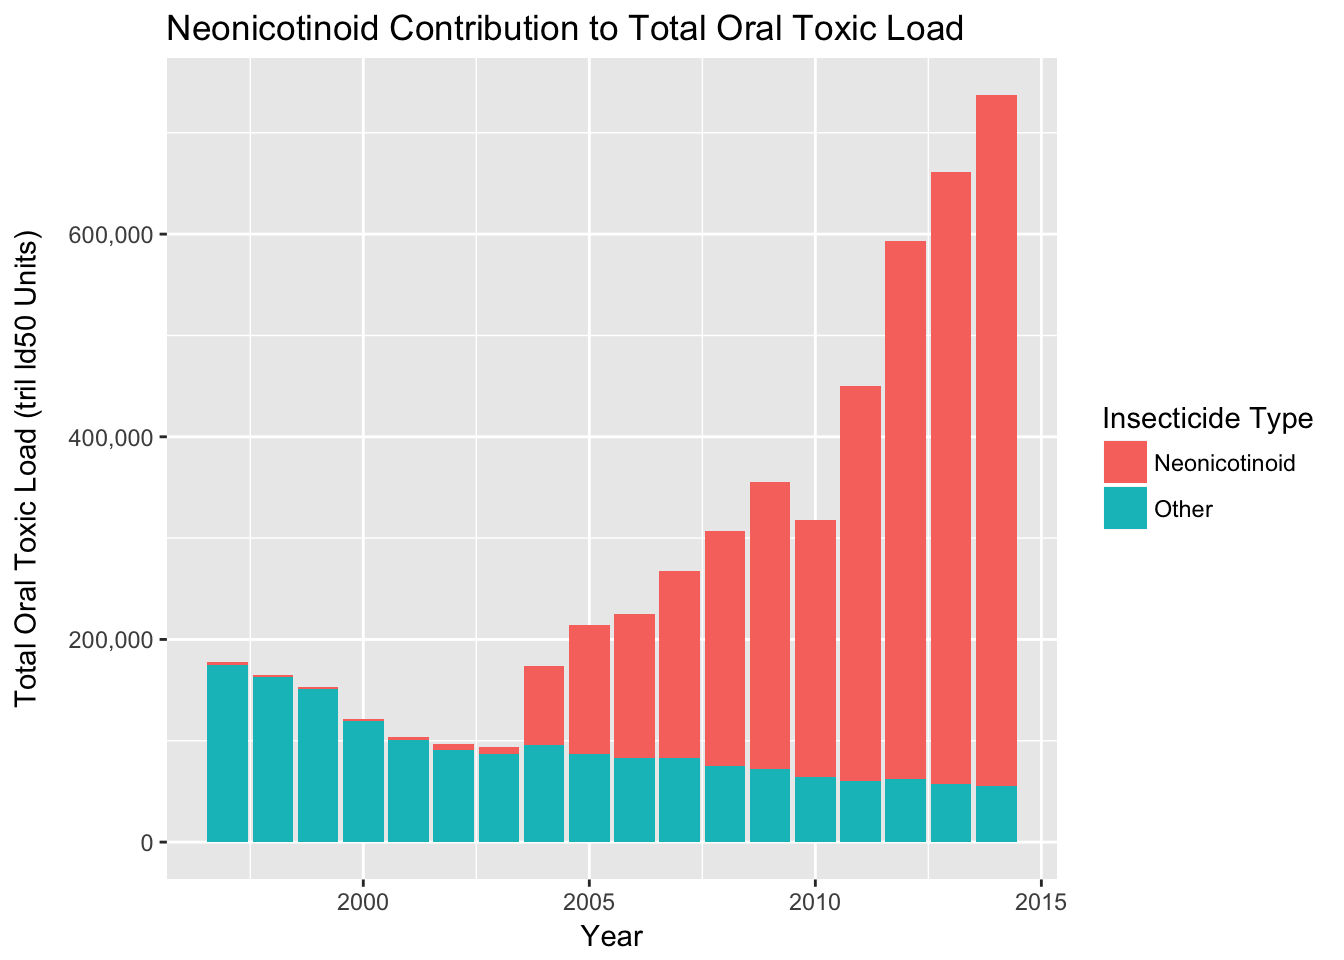
Neonicotinoids account for a lot more of the total contact toxic load now than they did in the past; and they seem to not only be replacing other insecticides, but also increasing the total amount of insecticides used. Let’s also take a look at neonicotinoids contribution to total oral toxic load:
Expand here to see past versions of unnamed-chunk-10-1.png:
| Version | Author | Date |
|---|---|---|
| 36cbc40 | ssoba | 2018-08-06 |
| b350230 | ssoba | 2018-08-03 |
| 3b811aa | ssoba | 2018-08-03 |
Neonicotinoids account for what looks like 90% of the Oral Toxic Load of all insecticides in the US! Again, we see not only replacement, but also additions in total toxic load due to neonicotinoids. This really means we should be learning more about the usage and environmental effects of neonicotinoids seeing as honeybees and other insects are almost guaranteed to be exposed to them.
So far we’ve seen a dramatic increase in neonicotinoid usage. Let’s see where these huge increases have been occurring and visualize which states use the most and which account for the highest toxic load of neonicotinoids.
Part 2:
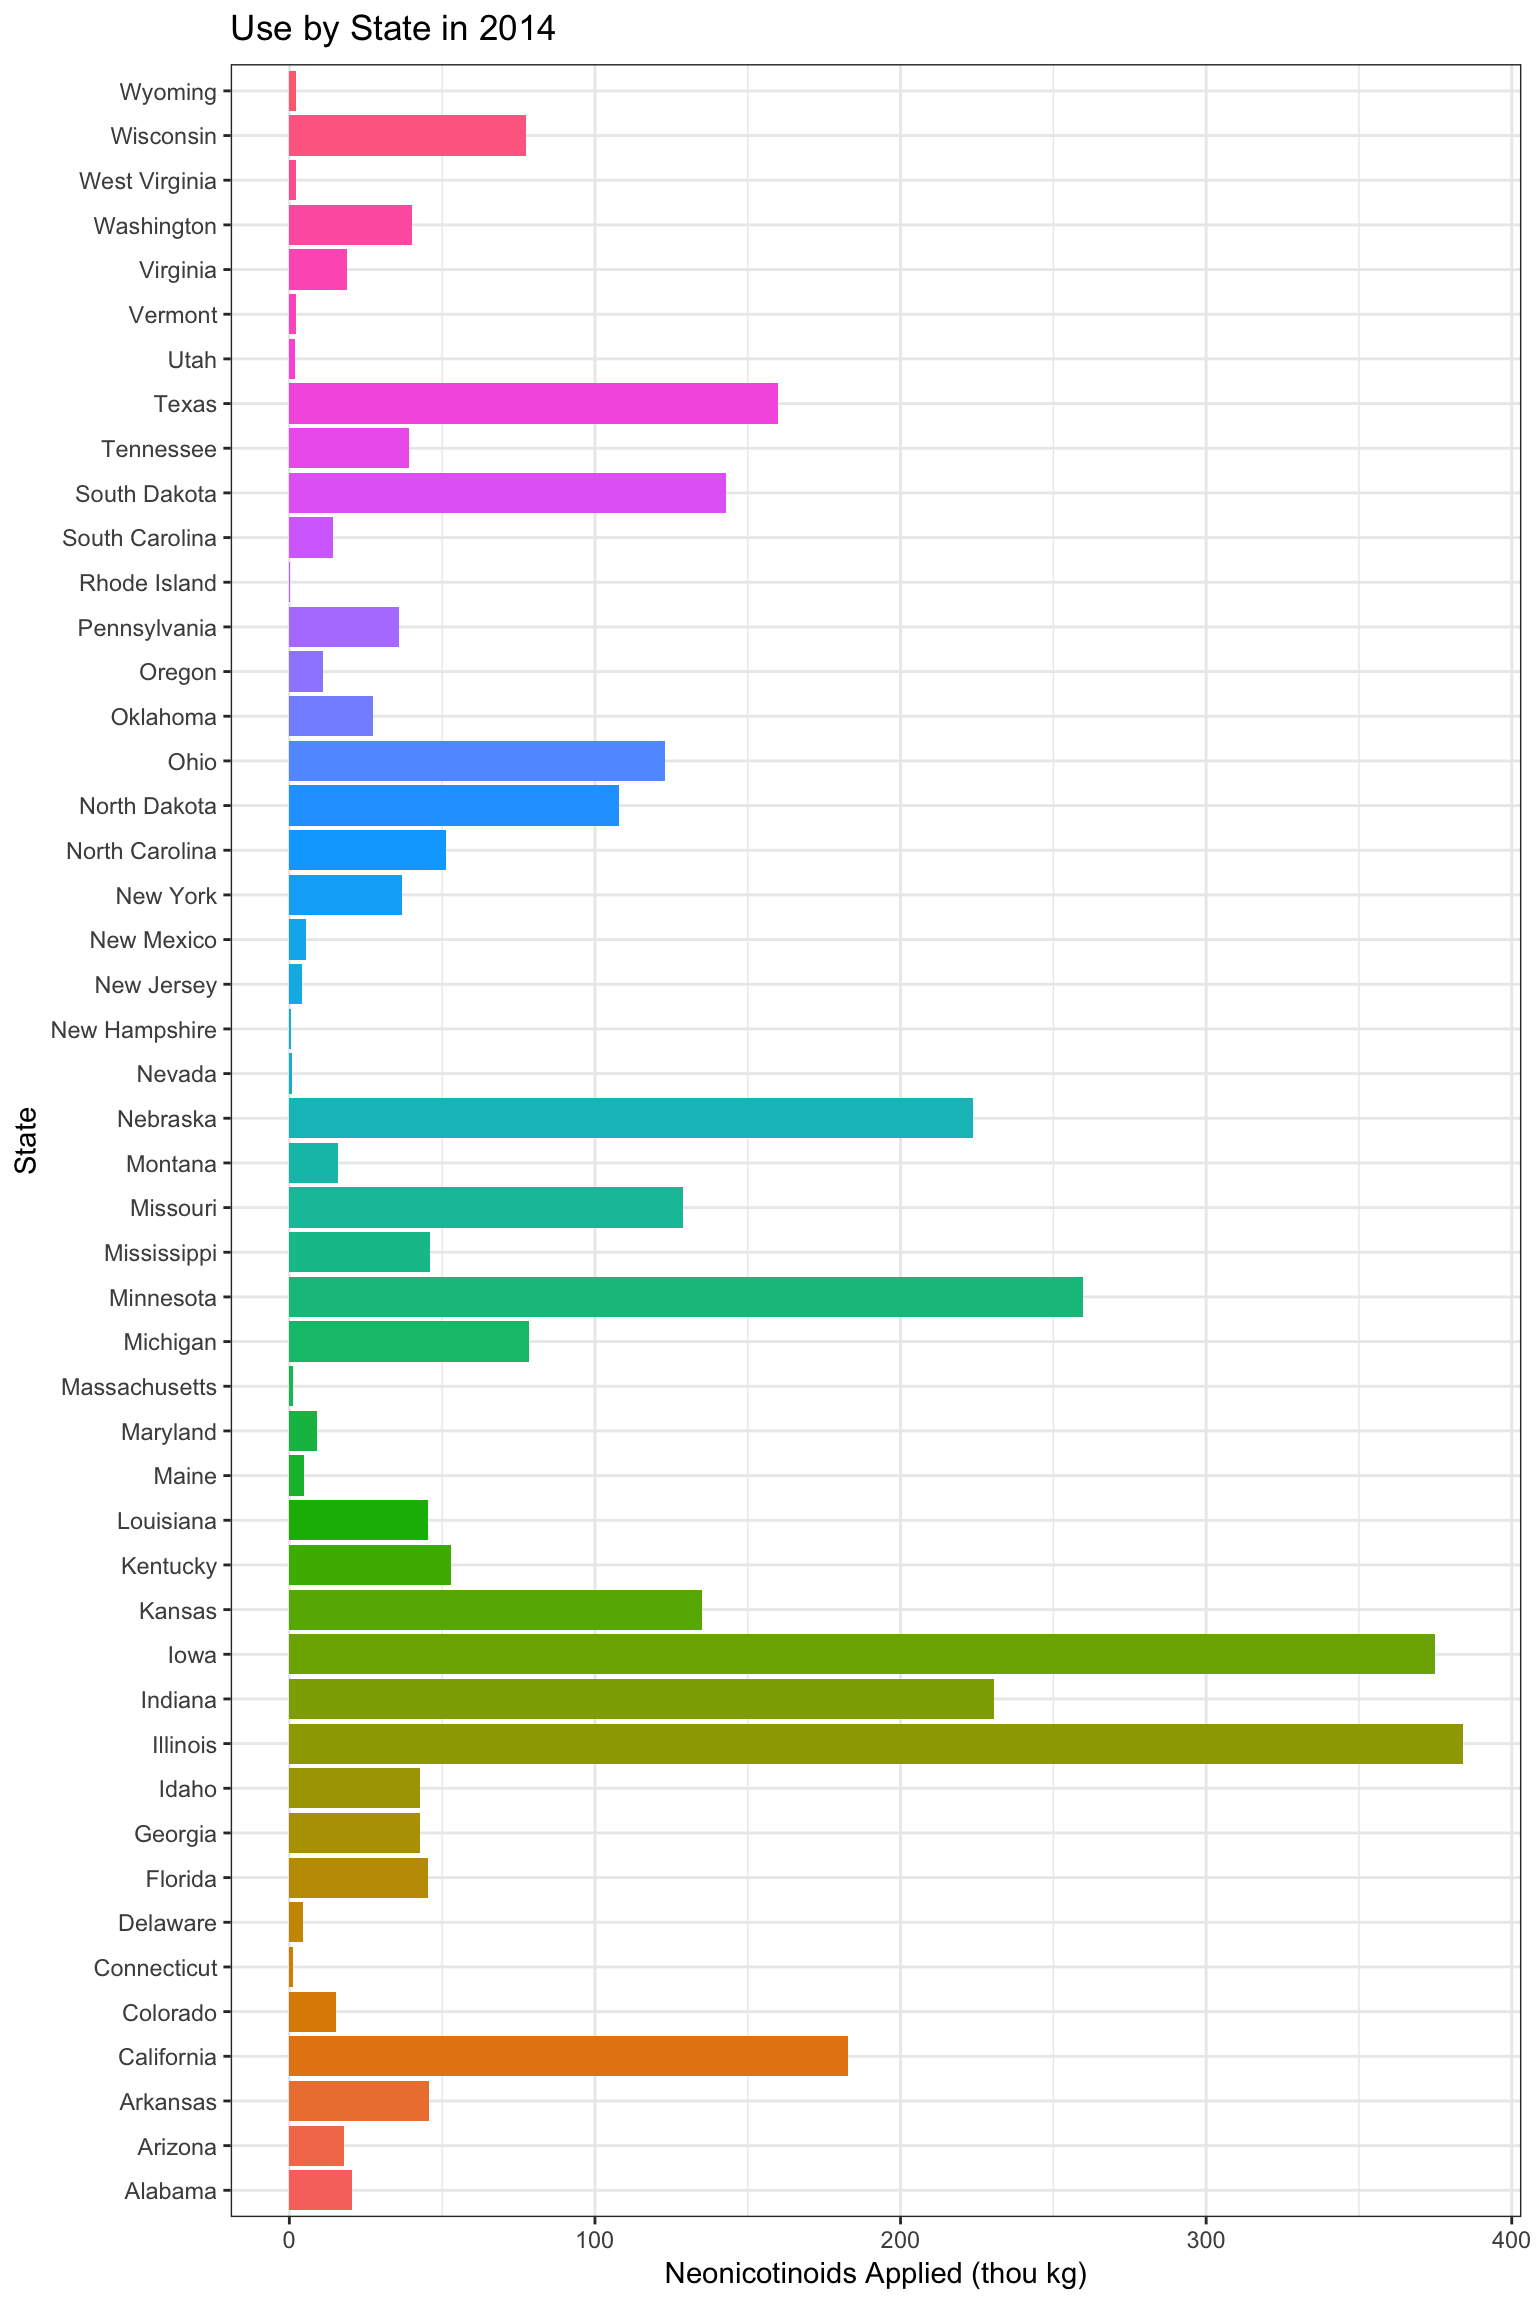
Where has the use been increasing the most?
Expand here to see past versions of unnamed-chunk-11-1.png:
| Version | Author | Date |
|---|---|---|
| f4ef47c | ssoba | 2018-08-07 |
| 36cbc40 | ssoba | 2018-08-06 |
| b350230 | ssoba | 2018-08-03 |
| 3ee9a38 | ssoba | 2018-08-02 |
Expand here to see past versions of unnamed-chunk-12-1.png:
| Version | Author | Date |
|---|---|---|
| 6d69e9e | ssoba | 2018-08-09 |
| 36cbc40 | ssoba | 2018-08-06 |
| b350230 | ssoba | 2018-08-03 |
| 3b811aa | ssoba | 2018-08-03 |
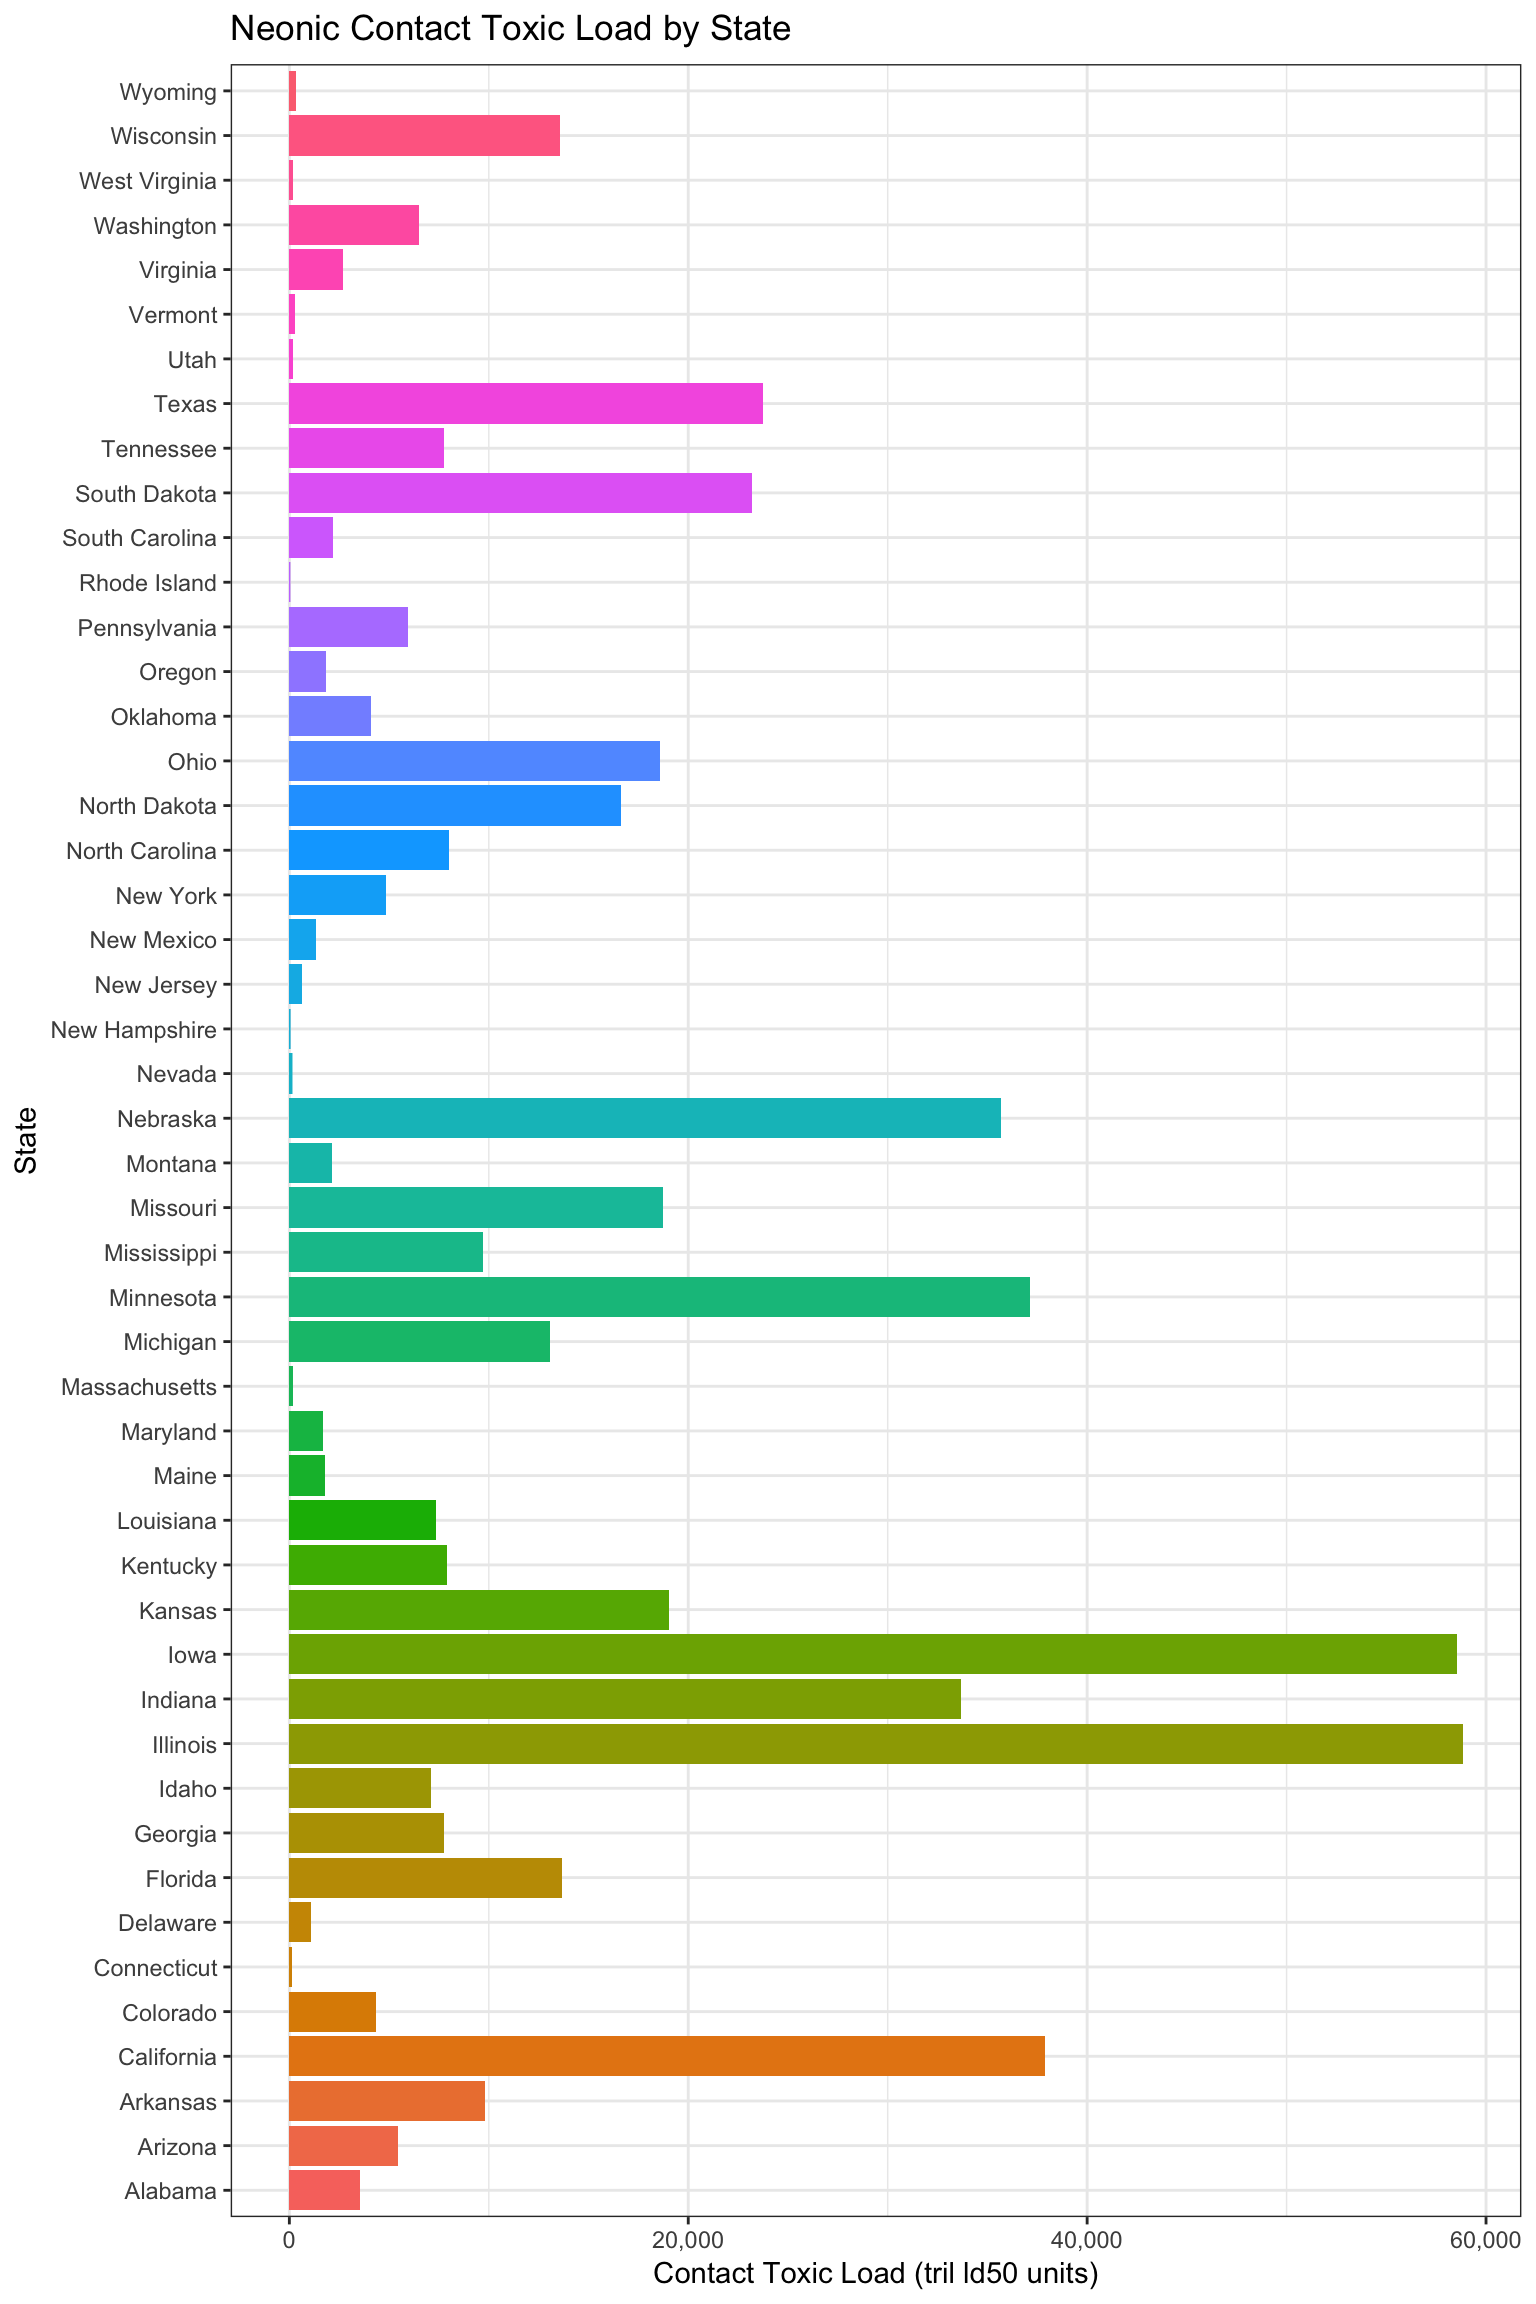
Looks like Iowa and Illinois are accounting for the most kg applied (and toxic load) of neonicotinoids.
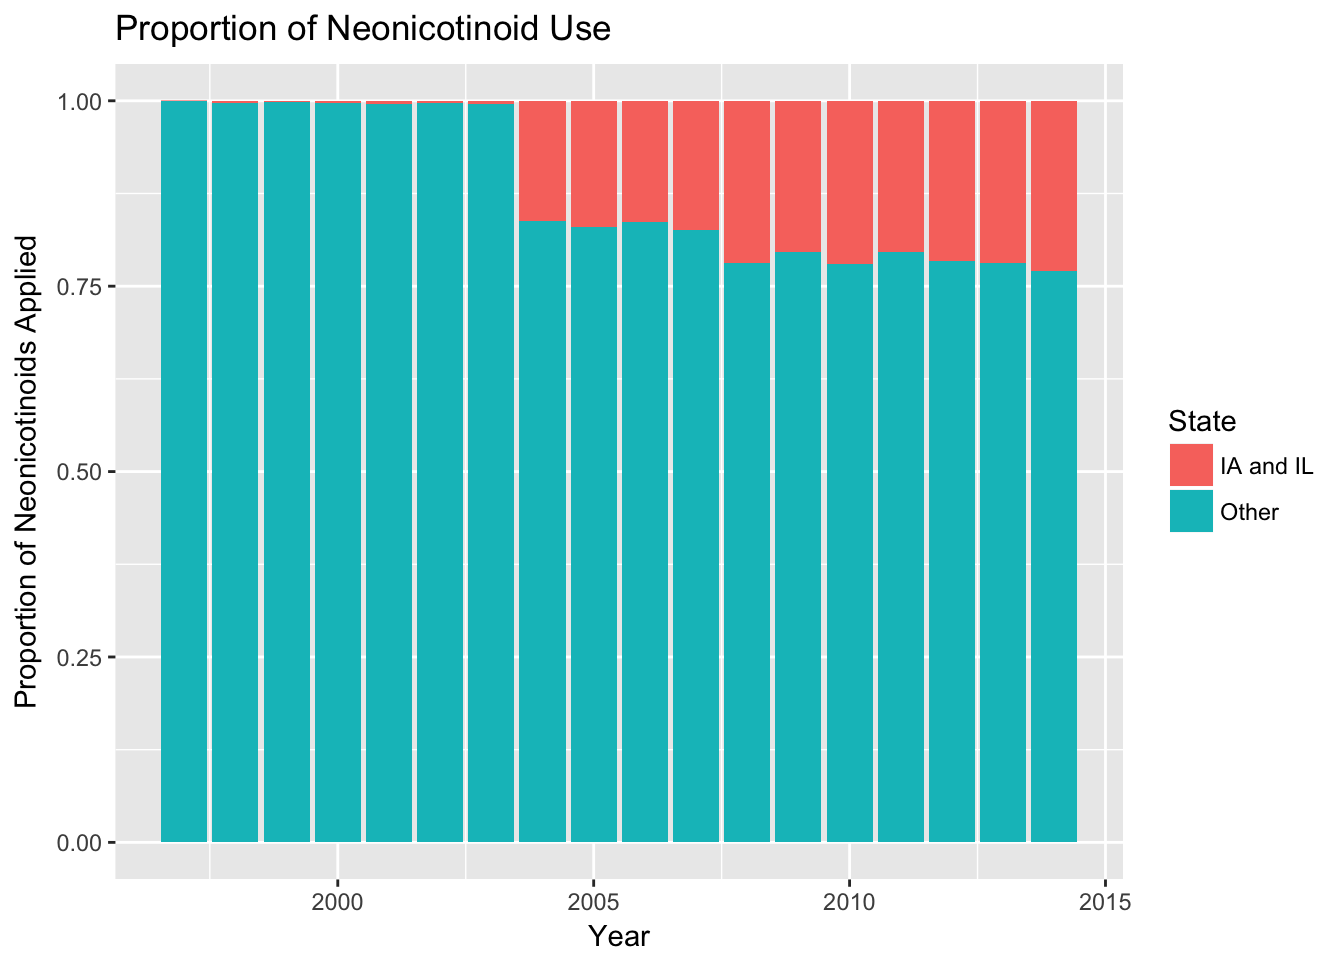
Iowa and Illinois: Neonicotinoid Hubs
As of 2014 (the most recent data), just two states, Iowa (IA) and Illinois (IL) accounted for 25% of all neonicotinoid use in the USA.
Expand here to see past versions of unnamed-chunk-14-1.png:
| Version | Author | Date |
|---|---|---|
| 36cbc40 | ssoba | 2018-08-06 |
| b350230 | ssoba | 2018-08-03 |
| 67b36d3 | ssoba | 2018-08-03 |
| 3b811aa | ssoba | 2018-08-03 |
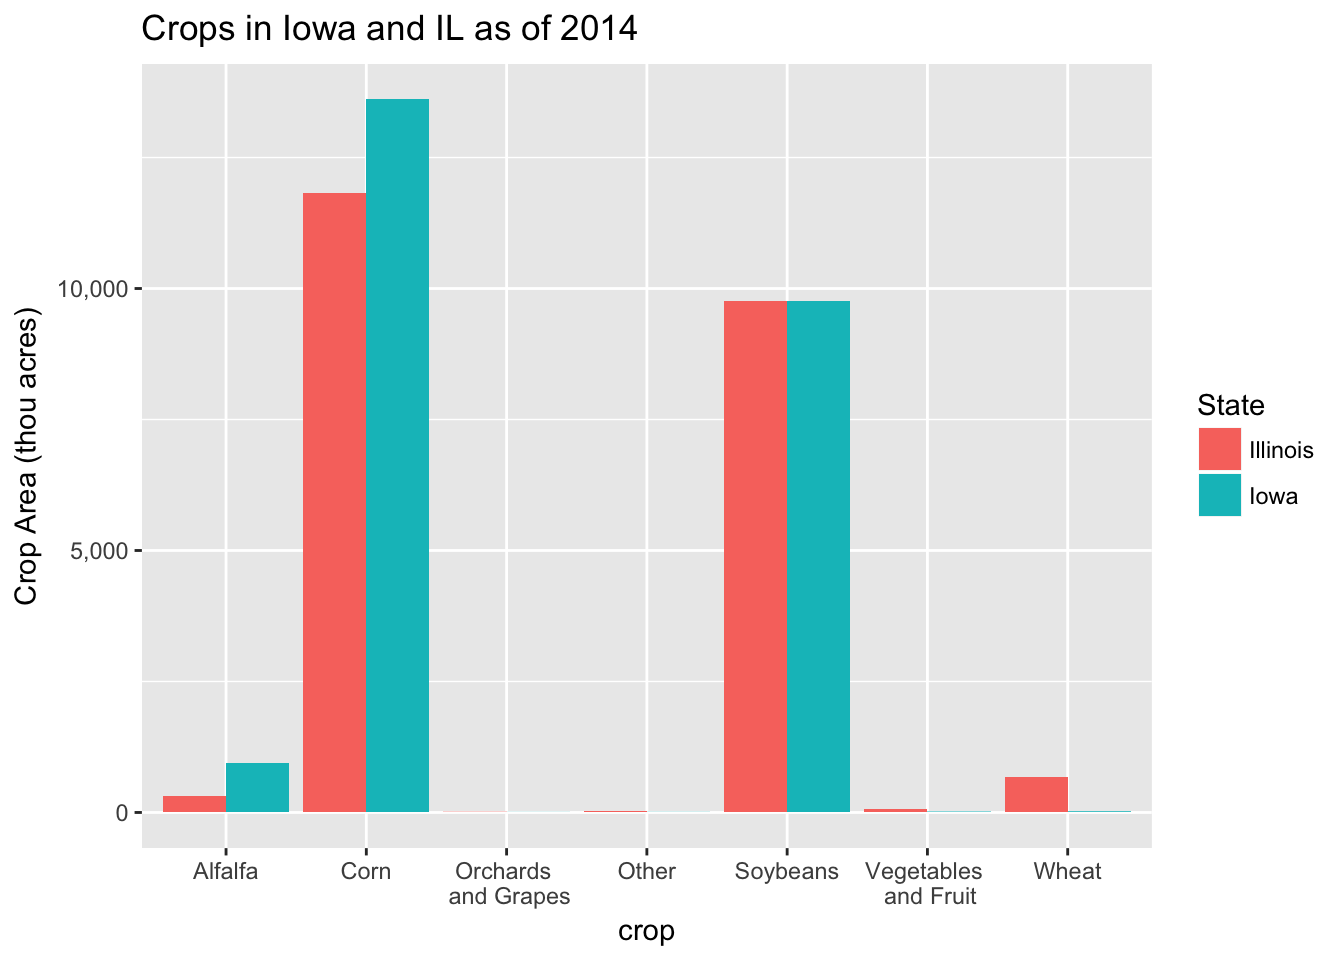
Why might that be? Let’s take a look at what’s growing in those two states.
Expand here to see past versions of unnamed-chunk-16-1.png:
| Version | Author | Date |
|---|---|---|
| fcdea4c | ssoba | 2018-08-09 |
| f4ef47c | ssoba | 2018-08-07 |
| 36cbc40 | ssoba | 2018-08-06 |
| b350230 | ssoba | 2018-08-03 |
| 67b36d3 | ssoba | 2018-08-03 |
| 3b811aa | ssoba | 2018-08-03 |
Looks like corn and soybeans are the dominant crops in both Iowa and Illinois. Let’s look at national data to see how much neonicotinoids are applied to these two crop types.
Neonicotinoid use by Crop over Time
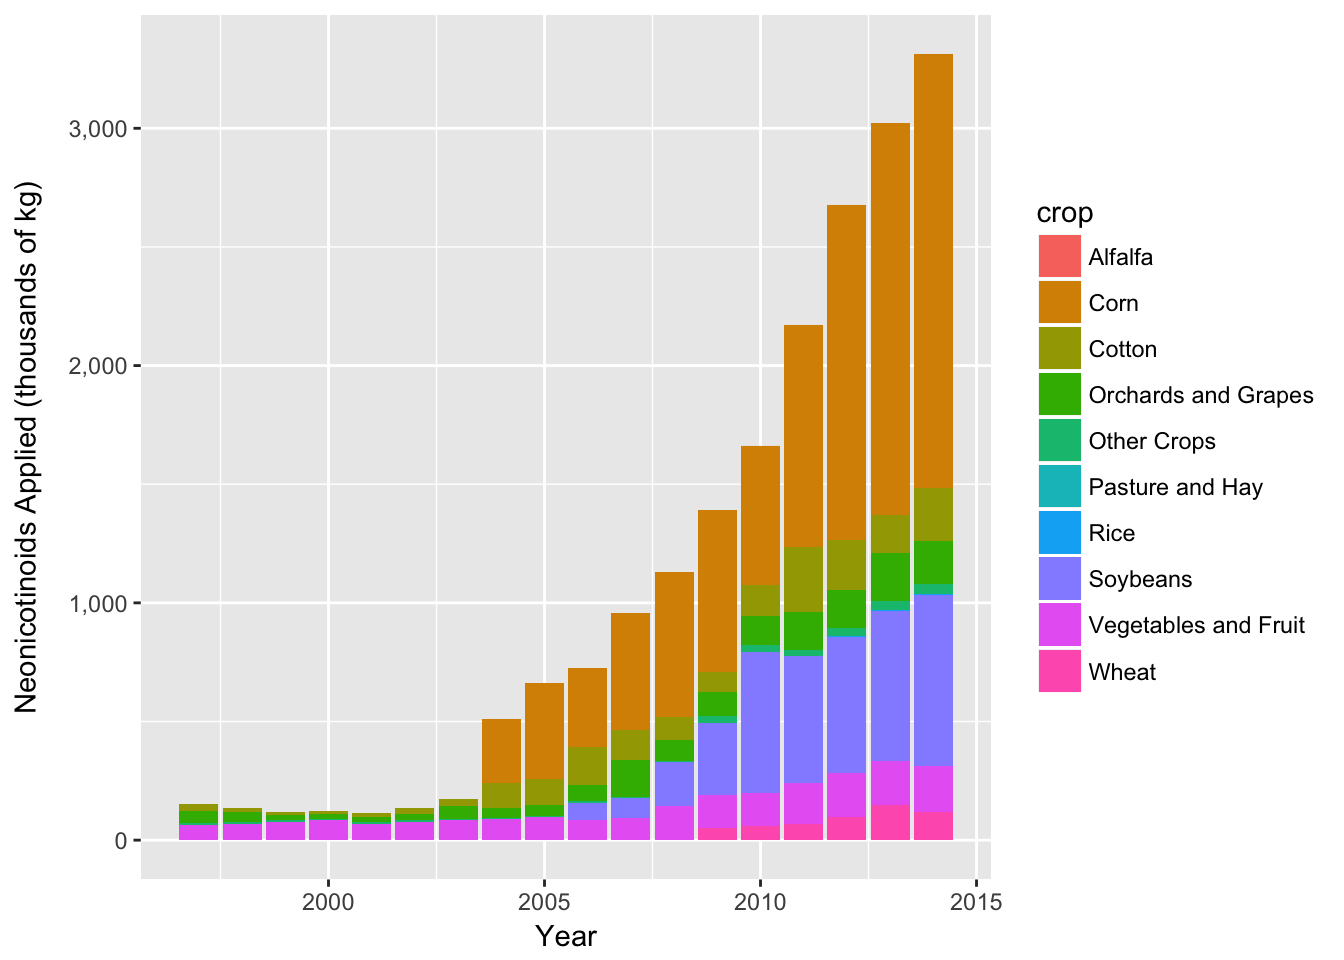
Expand here to see past versions of unnamed-chunk-17-1.png:
| Version | Author | Date |
|---|---|---|
| 6d69e9e | ssoba | 2018-08-09 |
| 36cbc40 | ssoba | 2018-08-06 |
| b350230 | ssoba | 2018-08-03 |
Neonicotinoids have increasingly been applied to all crops, especially corn and soybeans. This explains why the states with the most corn and soybean crops have the highest instance of neonicotinoid use and account for such a large proportion of the national neonicotinoid use.
Why those two crops? One possible explanation is seed treatments. Neonicotinoid seed treatments are common in both corn and soybeans and both crops occupy a lot of acreage in the United States.
Session information
sessionInfo()R version 3.5.0 (2018-04-23)
Platform: x86_64-apple-darwin15.6.0 (64-bit)
Running under: macOS High Sierra 10.13.6
Matrix products: default
BLAS: /Library/Frameworks/R.framework/Versions/3.5/Resources/lib/libRblas.0.dylib
LAPACK: /Library/Frameworks/R.framework/Versions/3.5/Resources/lib/libRlapack.dylib
locale:
[1] en_US.UTF-8/en_US.UTF-8/en_US.UTF-8/C/en_US.UTF-8/en_US.UTF-8
attached base packages:
[1] stats graphics grDevices utils datasets methods base
other attached packages:
[1] bindrcpp_0.2.2 scales_0.5.0 dplyr_0.7.5 ggplot2_2.2.1
loaded via a namespace (and not attached):
[1] Rcpp_0.12.17 bindr_0.1.1 knitr_1.20
[4] whisker_0.3-2 magrittr_1.5 workflowr_1.1.1
[7] tidyselect_0.2.4 munsell_0.5.0 colorspace_1.3-2
[10] R6_2.2.2 rlang_0.2.1 stringr_1.3.1
[13] plyr_1.8.4 tools_3.5.0 grid_3.5.0
[16] gtable_0.2.0 R.oo_1.22.0 git2r_0.22.1
[19] htmltools_0.3.6 assertthat_0.2.0 yaml_2.1.19
[22] lazyeval_0.2.1 rprojroot_1.3-2 digest_0.6.15
[25] tibble_1.4.2 purrr_0.2.5 R.utils_2.6.0
[28] glue_1.2.0 evaluate_0.10.1 rmarkdown_1.10
[31] labeling_0.3 stringi_1.2.3 pillar_1.2.3
[34] compiler_3.5.0 backports_1.1.2 R.methodsS3_1.7.1
[37] pkgconfig_2.0.1 This reproducible R Markdown analysis was created with workflowr 1.1.1