Creating example maps
Maggie Douglas
Last updated: 2022-10-24
Purpose
This code uses previously generated raster files and creates maps from them.
Load data and libraries
library(sp)
library(sf)
Linking to GEOS 3.9.1, GDAL 3.4.0, PROJ 8.1.1; sf_use_s2() is TRUElibrary(USAboundaries)
library(raster)
library(viridis)Loading required package: viridisLite# load one raster to get CRS info
pa_or <- raster("../output_big/rasters/test/CDL_2012_42.ld50_or_ha_bil.tif")
# PA border - download via USAboundaries
pa <- us_states(states = "Pennsylvania")
st_crs(pa) # check coordinate reference systemCoordinate Reference System:
User input: EPSG:4326
wkt:
GEOGCRS["WGS 84",
DATUM["World Geodetic System 1984",
ELLIPSOID["WGS 84",6378137,298.257223563,
LENGTHUNIT["metre",1]]],
PRIMEM["Greenwich",0,
ANGLEUNIT["degree",0.0174532925199433]],
CS[ellipsoidal,2],
AXIS["geodetic latitude (Lat)",north,
ORDER[1],
ANGLEUNIT["degree",0.0174532925199433]],
AXIS["geodetic longitude (Lon)",east,
ORDER[2],
ANGLEUNIT["degree",0.0174532925199433]],
USAGE[
SCOPE["Horizontal component of 3D system."],
AREA["World."],
BBOX[-90,-180,90,180]],
ID["EPSG",4326]]pa_GRS80 <- st_transform(pa, projection(pa_or)) # re-project to CRS of rasters
pa_poly <- as(st_geometry(pa_GRS80), "Spatial")
# load maps
cdl <- raster('../data_big/cdl/CDL_2012_42/CDL_2012_42_clip.tif')
pa_or <- raster('../output_big/rasters/test/CDL_2012_42.ld50_or_ha_bil_clip.tif')
pa_gly <- raster('../output_big/rasters/test/gly/CDL_2012_42.kg_ha_clip.tif')
pa_mef <- raster('../output_big/rasters/test/mef/CDL_2012_42.kg_ha_clip.tif')
pa_imi <- raster('../output_big/rasters/test/imi/CDL_2012_42.kg_ha_clip.tif')
pa_cov <- raster('../output_big/rasters/test/CDL_2012_42.coverage.tif')Make maps
# CDL input map
# note that this does not use the categorical legend associated with CropScape
plot(cdl,
     axes = FALSE,
     box = FALSE,
     legend.args = list(text = "")) +
title('a) Cropland Data Layer (USDA)', line = 1, adj = 0, cex.main = 1.4) +
plot(st_geometry(pa_GRS80), add = TRUE)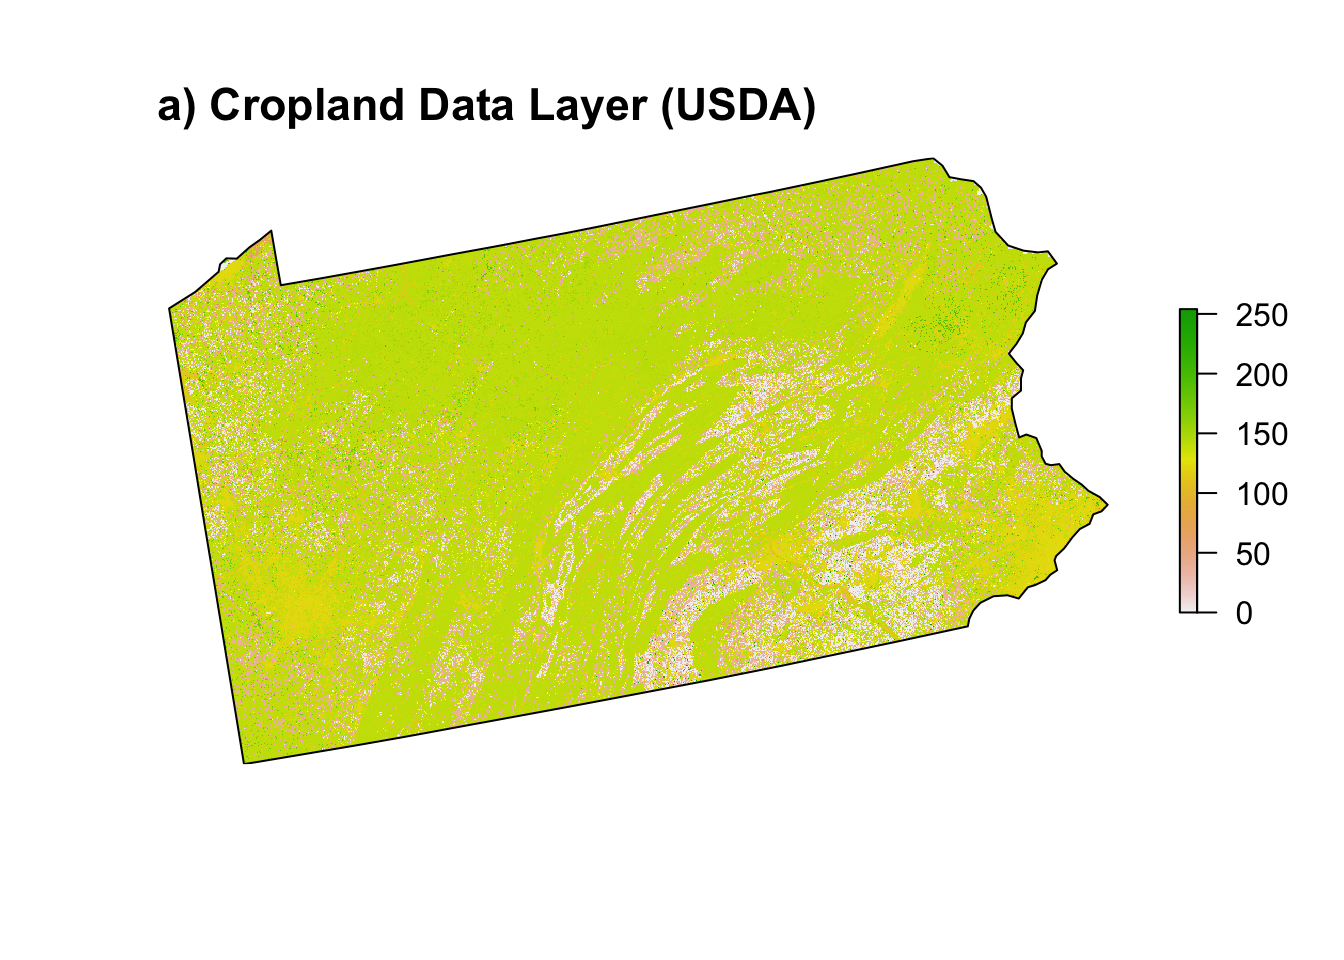
integer(0)# Estimate coverage
brk <- c(0, 1, 2, 3)
arg <- list(at=c(0.5,1.5,2.5), labels=c("Not\ncropland","Not\nsurveyed","Surveyed"), cex.axis = 0.8)
plot(pa_cov,
col=colorRampPalette(c("white", "violetred", "gray80"))(3),
axis.args = arg,
breaks = brk,
axes = FALSE,
box = FALSE,
#horizontal = TRUE,
legend.args = list(text = "")) +
title('b) Pesticide estimate coverage', line = 1, adj = 0, cex.main = 1.4) +
plot(st_geometry(pa_GRS80), add = TRUE)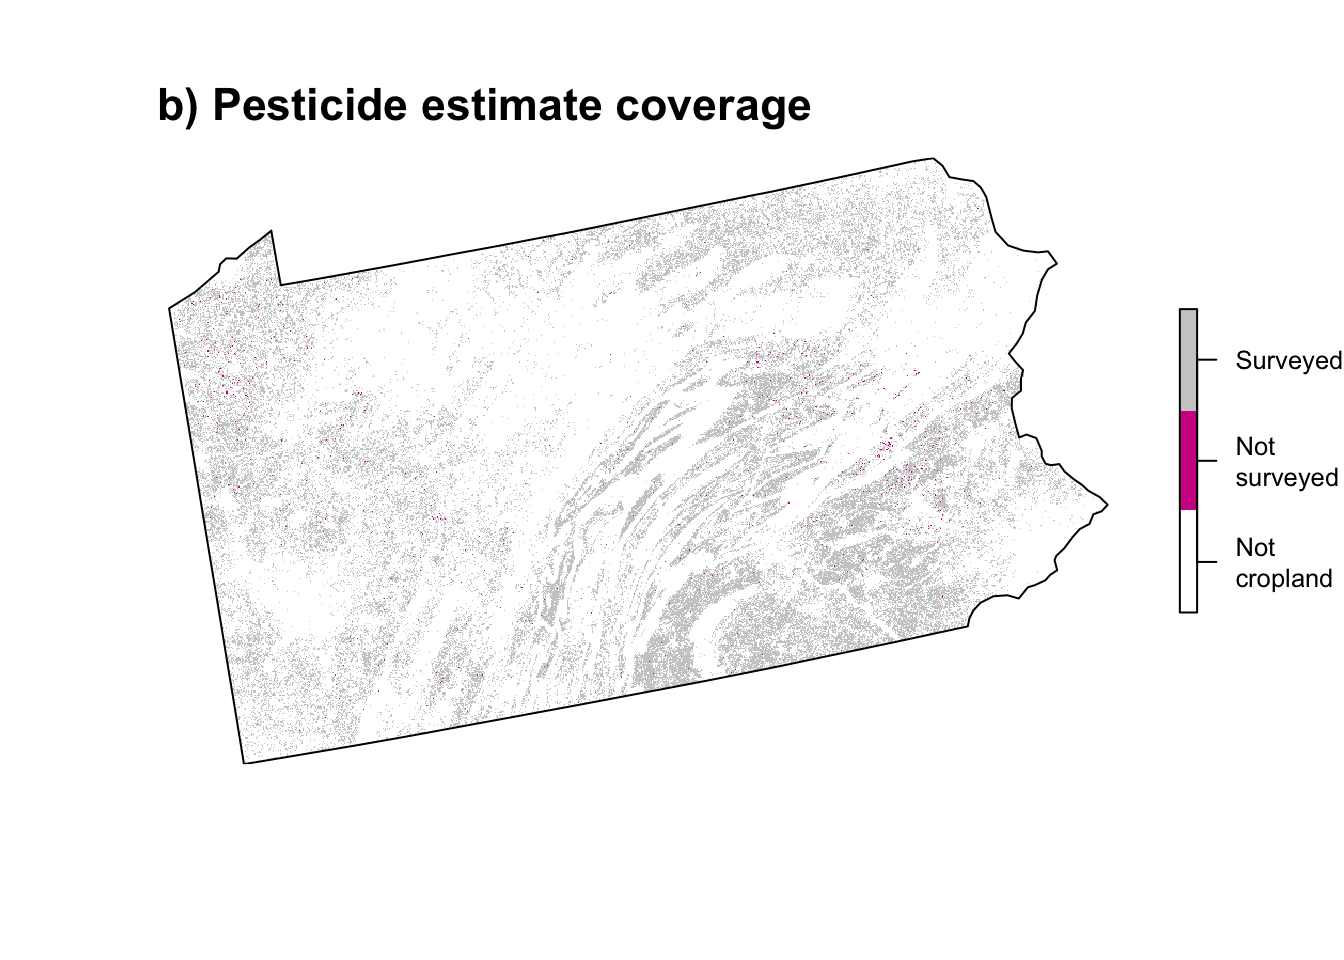
integer(0)https://rdrr.io/cran/raster/man/plot.html (example code for plotting rasters) https://gis.stackexchange.com/questions/347333/check-for-nas-in-rasterlayer-and-plot-them-in-different-colour (setting NA color) https://stackoverflow.com/questions/9436947/legend-properties-when-legend-only-t-raster-package (adjusting legends in plot.raster)
# Bee toxic load (oral)
plot(pa_or,
     axes = FALSE,
     box = FALSE,
     col = viridis(265, direction = -1),
     legend.args = list(text = "LD50 per ha\n(billion)", line = 1, cex = 1.2),
     axis.args=list(cex.axis = 1.1)) +
     title('c) Bee toxic load - Oral (I)', line = 1, adj = 0, cex.main = 1.4) +
plot(st_geometry(pa_GRS80), add = TRUE)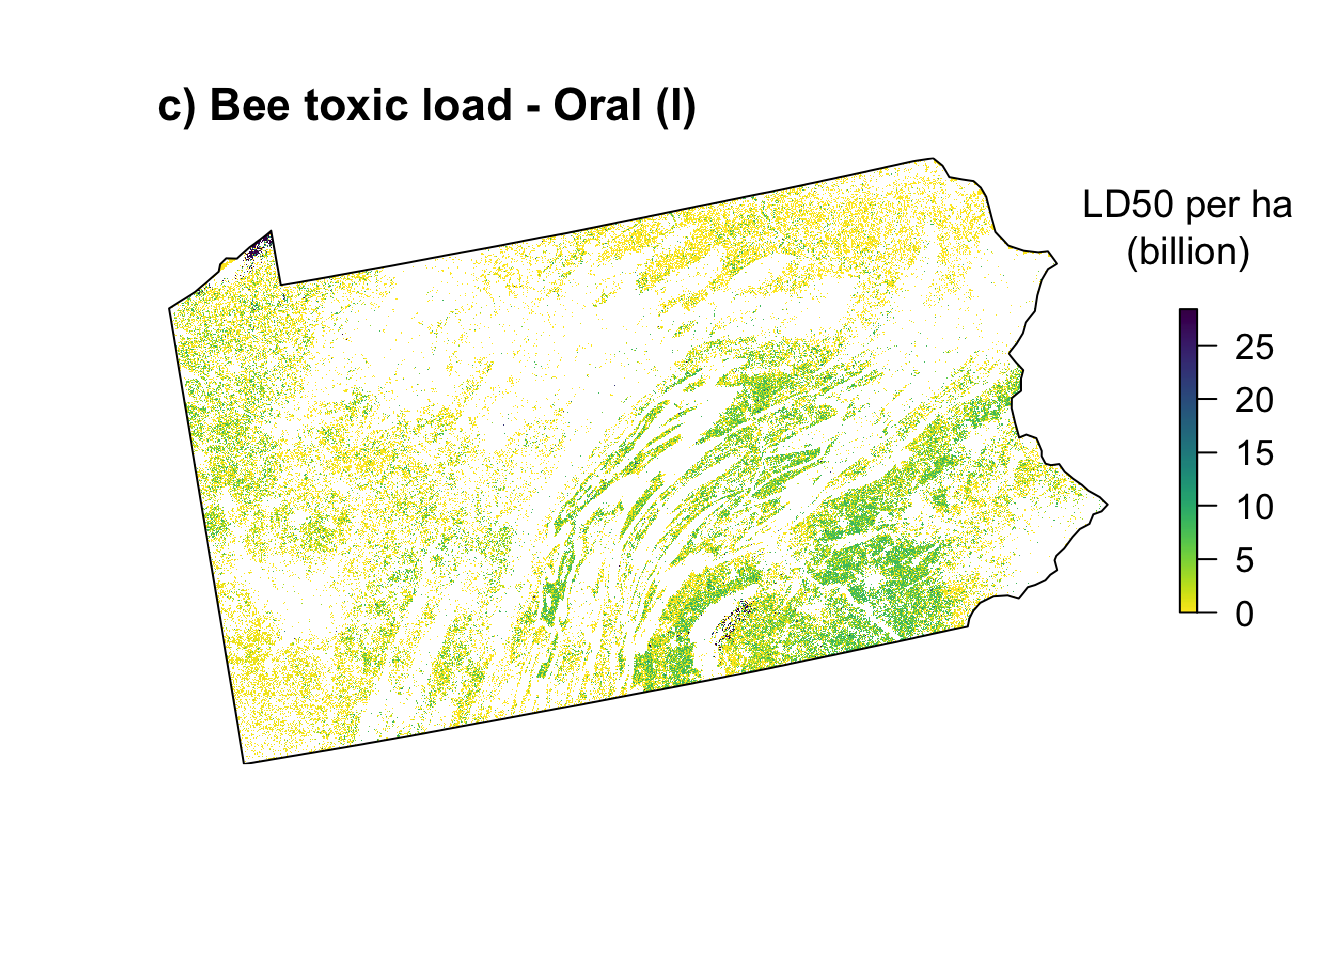
integer(0)# Imidacloprid
plot(pa_imi,
axes = FALSE,
box = FALSE,
col = viridis(265, direction = -1),
legend.args = list(text = "kg per ha", line = 1, cex = 1.2),
axis.args=list(cex.axis = 1.1)) +
title('d) Imidacloprid (I)', line = 1, adj = 0, cex.main = 1.4) +
plot(st_geometry(pa_GRS80), add = TRUE)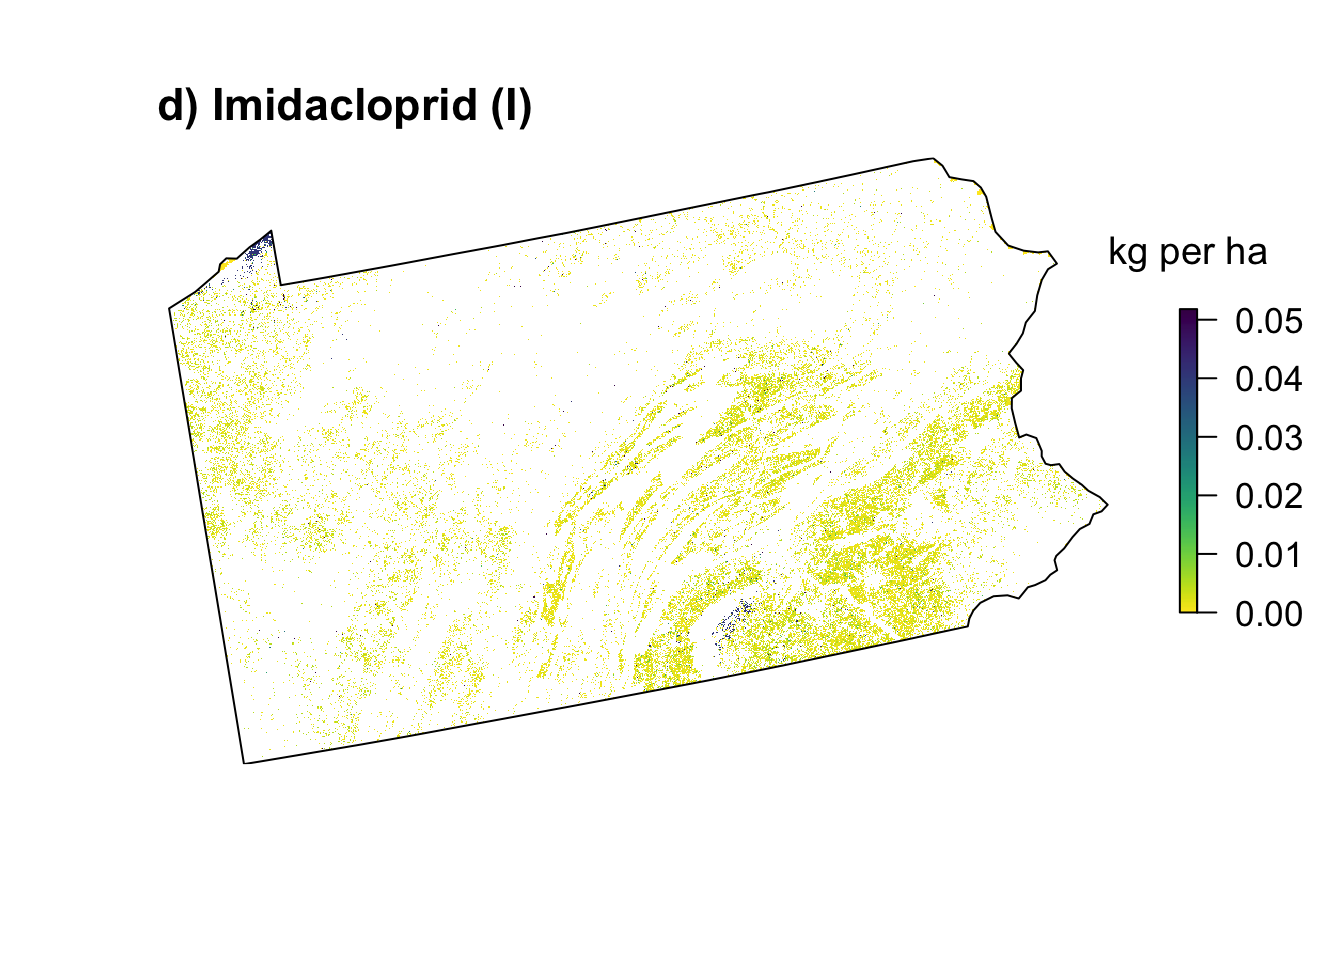
integer(0)# Glyphosate
plot(pa_gly,
axes = FALSE,
box = FALSE,
col = viridis(265, direction = -1),
legend.args = list(text = "kg per ha", line = 1, cex = 1.2),
axis.args=list(cex.axis = 1.1)) +
title('e) Glyphosate (H)', line = 1, adj = 0, cex.main = 1.4) +
plot(st_geometry(pa_GRS80), add = TRUE)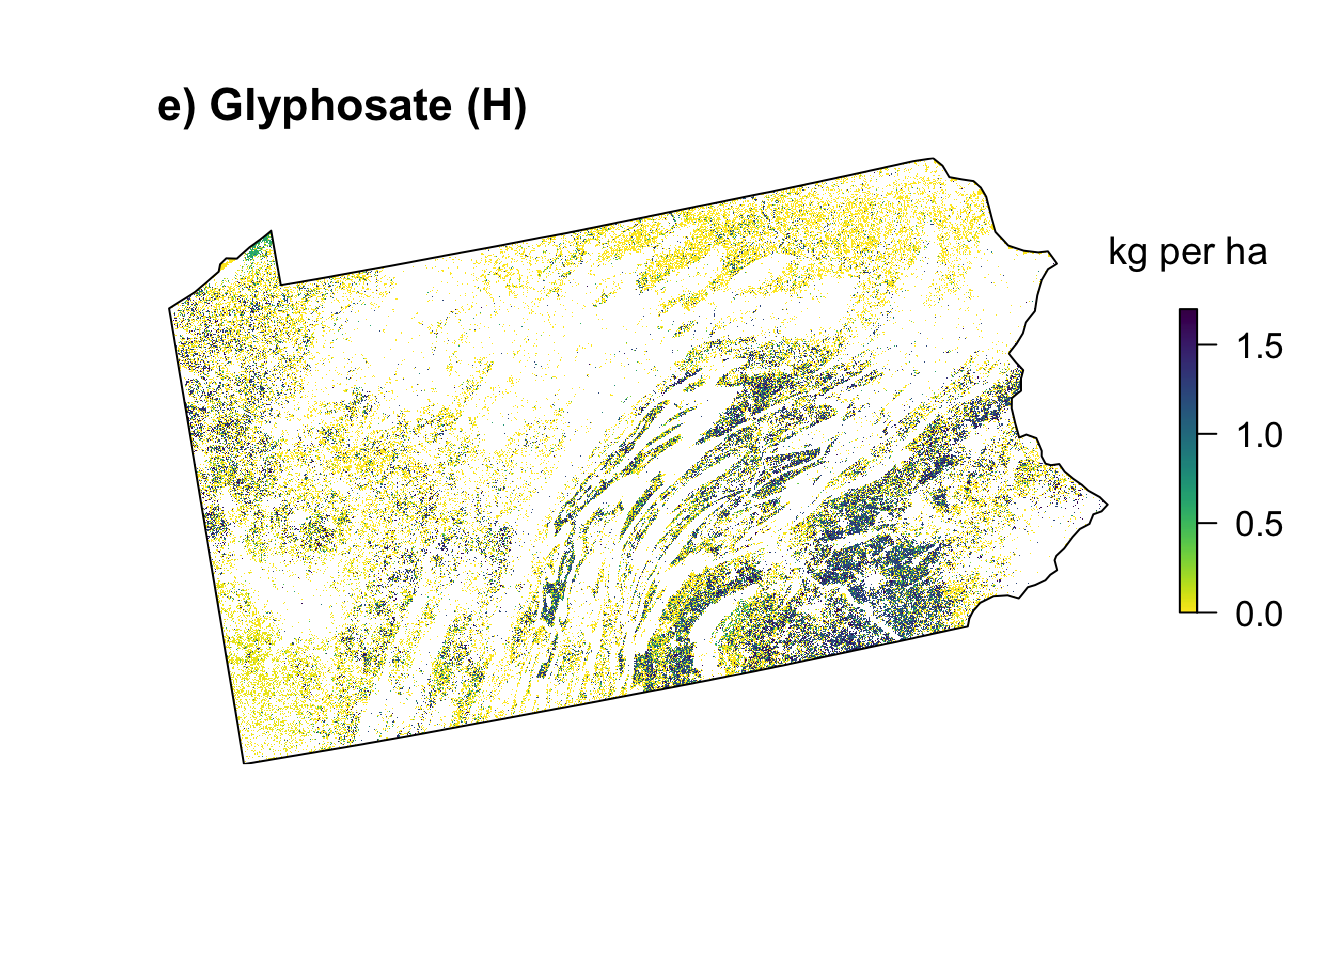
integer(0)# Mefenoxam
plot(pa_mef,
axes = FALSE,
box = FALSE,
col = viridis(265, direction = -1),
legend.args = list(text = "kg per ha", line = 1, cex = 1.2),
axis.args=list(cex.axis = 1.1)) +
title('f) Mefenoxam (F)', line = 1, adj = 0, cex.main = 1.4) +
plot(st_geometry(pa_GRS80), add = TRUE)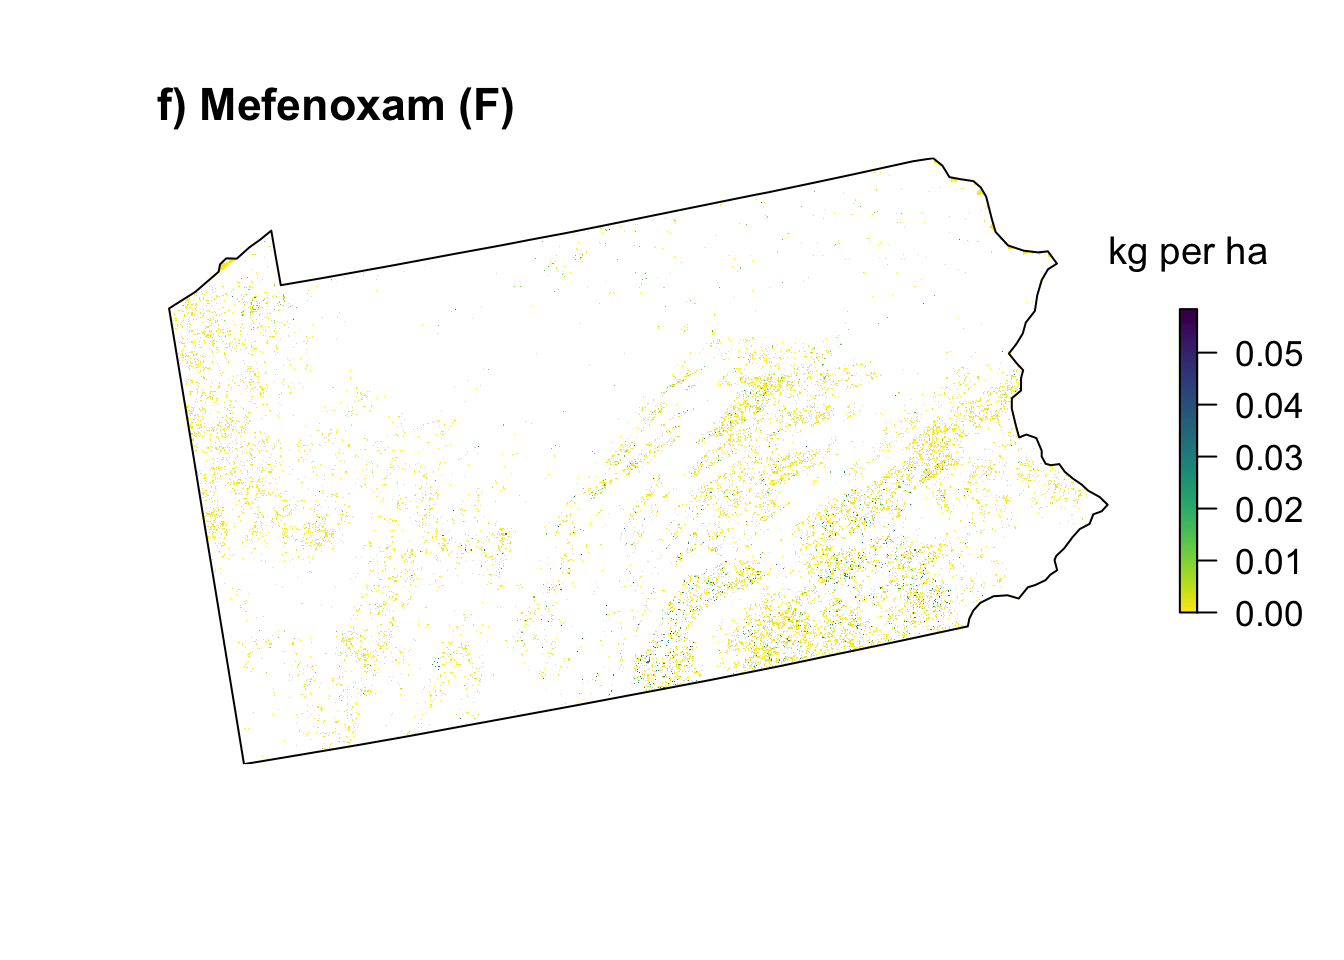
integer(0)This R Markdown site was created with workflowr